
Mathematics, 29.10.2020 15:50 Kennethabrown09
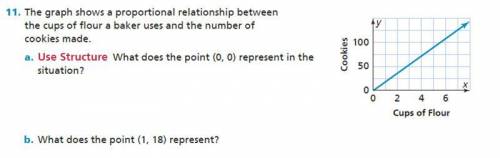
The graph shows a proportional relationship between the cups of flour a baker uses and the number of cookies made
A. what does the point 0 0 represent in the situation
B. what does the point (1,18) represent

Answers: 3


Other questions on the subject: Mathematics
Mathematics, 21.06.2019 12:30, 11needhelp11
Convert 16 yards to feet use the conversion rate 3 feet = 1 yard
Answers: 1
Mathematics, 21.06.2019 18:00, kezin
The sat and act tests use very different grading scales. the sat math scores follow a normal distribution with mean 518 and standard deviation of 118. the act math scores follow a normal distribution with mean 20.7 and standard deviation of 5. suppose regan scores a 754 on the math portion of the sat. how much would her sister veronica need to score on the math portion of the act to meet or beat regan's score?
Answers: 1
Mathematics, 21.06.2019 20:00, naimareiad
Ialready asked this but i never got an answer. will give a high rating and perhaps brainliest. choose the linear inequality that describes the graph. the gray area represents the shaded region. y ≤ –4x – 2 y > –4x – 2 y ≥ –4x – 2 y < 4x – 2
Answers: 1
Mathematics, 22.06.2019 01:00, kam110800
1) your friend taylor missed class today and needs some identifying solutions of systems. explain to taylor where to find the solution(s) of any system using its graph 2)taylor graphs the following in desmos and decides that f(x) = g(x) at x = 0, x = 1, & x = 3. f(x) = 2x+1g(x) = 2x2+1 provide taylor some feedback that explains which part of the answer was incorrect and why.
Answers: 1
You know the right answer?
The graph shows a proportional relationship between the cups of flour a baker uses and the number of...
Questions in other subjects:


Physics, 03.07.2019 05:00

Chemistry, 03.07.2019 05:00


Spanish, 03.07.2019 05:00


