
Mathematics, 28.10.2020 23:30 danielahchf
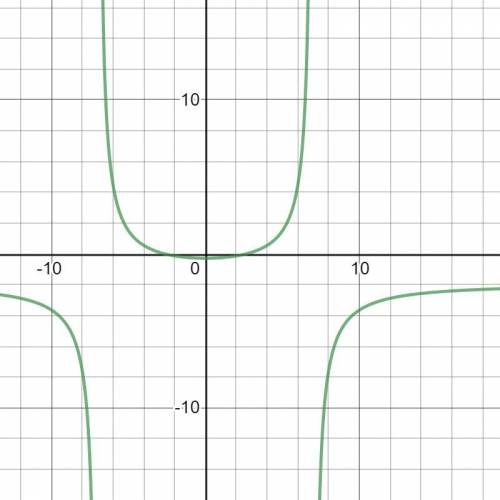
Which statement describes the behavior of the graph of the function shown at the vertical asymptotes?
As x approaches -7 from the left, y approaches ∞.
As x approaches -7 from the right, y approaches -∞.
As x approaches 7 from the left, y approaches –∞.
As x approaches 7 from the right, y approaches –∞.

Answers: 2


Other questions on the subject: Mathematics
Mathematics, 21.06.2019 20:00, soph10131
M the table below represents a linear function f(x) and the equation represents a function g(x): x f(x)−1 −50 −11 3g(x)g(x) = 2x − 7part a: write a sentence to compare the slope of the two functions and show the steps you used to determine the slope of f(x) and g(x). (6 points)part b: which function has a greater y-intercept? justify your answer. (4 points)
Answers: 3
Mathematics, 22.06.2019 03:00, travisvb
Will give the box plots below show the math scores of students in two different classes: class a 55 72 75 89 95 class b 55 70 75 94 100 based on the box plots, which statement is correct? a: the median score of class a is greater than the median score of class b. b: the lower quartile of class a is greater than the lower quartile of class b. c: the upper quartile of class a is greater than the upper quartile of class b. d: the maximum score of class a is greater than the maximum score of class b.
Answers: 1
You know the right answer?
Which statement describes the behavior of the graph of the function shown at the vertical asymptotes...
Questions in other subjects:

Mathematics, 11.05.2021 03:10


English, 11.05.2021 03:10
Mathematics, 11.05.2021 03:10

Mathematics, 11.05.2021 03:10
Chemistry, 11.05.2021 03:10


