
Mathematics, 28.10.2020 21:40 estheradame547
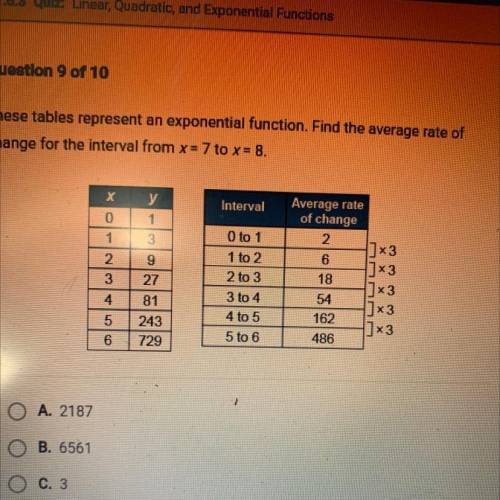
These tables represent an exponential function. Find the average rate of
change for the interval from x= 7 to x = 8.
Interval
A. 2187
B. 6561
C. 3
D. 4374

Answers: 1


Other questions on the subject: Mathematics
Mathematics, 21.06.2019 16:00, thicklooney
Afactory adds 3 red drops and 2 blue drops of coloring to white paint to make each pint of purple paint. the factory will make 50 gallons of the purple paint. how many drops of red and blue coloring will the factory need in the 50 gallon batch of purple paint.
Answers: 1
Mathematics, 21.06.2019 19:00, callmedarthvadorplz
Which expression is equivalent to 3^3 + 2^2?
Answers: 1
Mathematics, 21.06.2019 19:00, tanaemichel
John used linear combination to solve the system of equations shown. he did so by multiplying the first equation by -3 and the second equation by another number to eliminate the x-terms. what number did jonas multiply the second equation by? 4x-6y=23x+5y=11
Answers: 2
You know the right answer?
These tables represent an exponential function. Find the average rate of
change for the interval fr...
Questions in other subjects:

History, 16.10.2020 08:01
Mathematics, 16.10.2020 08:01


Mathematics, 16.10.2020 08:01
Mathematics, 16.10.2020 08:01


