
Mathematics, 28.10.2020 02:30 hernandezbrandon059
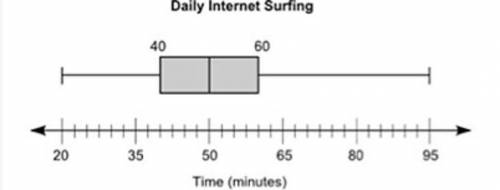
The box plot below shows the total amount of time, in minutes, the students of a class surf the Internet every day:
A box plot is shown. The left-most point on the plot is 20 and the right-most point is 95. The box is labeled 40 on the left edge and 60 on the right edge. A vertical line is drawn inside the rectangle at point 50.
Part A: List two pieces of information that are provided by the graph and one piece of information that is not provided by the graph. (4 points)
Part B: Calculate the interquartile range of the data, and explain in a sentence or two what it represents. (4 points)
Part C: Explain what affect, if any, there will be if an outlier is present. (2 points)

Answers: 3


Other questions on the subject: Mathematics
Mathematics, 21.06.2019 17:00, savannahsims4750
If i have a 24 in loaf of bread and i cut it into two pieces one 9 in how long was the other
Answers: 2
Mathematics, 21.06.2019 18:00, jackievelasquez3424
Find the perimeter of the figure shown above. a. 18 yds c. 20 yds b. 10 yds d. 24 yds select the best answer from the choices provided
Answers: 1
Mathematics, 21.06.2019 18:30, mackwackuwu
The square pyramid has a volume of 441 cubic inches. what is the value of x? 1/7x is the height x is the base
Answers: 1
Mathematics, 21.06.2019 19:30, daquanmcqueen77
Are triangles the congruent? write the congruency statement. what is the congruency that proves they are congruent? what is the perimeter of ∆pqr?
Answers: 1
You know the right answer?
The box plot below shows the total amount of time, in minutes, the students of a class surf the Inte...
Questions in other subjects:


Physics, 23.10.2021 09:20
Mathematics, 23.10.2021 09:20

Chemistry, 23.10.2021 09:20

English, 23.10.2021 09:20


