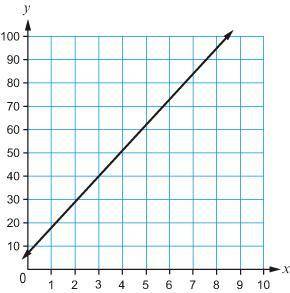
What is the average rate of change for the line shown in the graph?
...

Mathematics, 27.10.2020 17:40 Ltik11900
What is the average rate of change for the line shown in the graph?

Answers: 1


Other questions on the subject: Mathematics
Mathematics, 21.06.2019 14:30, stacy021603
In trapezoid efgh, m∠hef=(4x2+16)∘ and m∠gfe=(5x2+12)∘. find the value of x so that efgh is isosceles.
Answers: 1
Mathematics, 21.06.2019 17:00, alannismichelle9
The following graph shows the consumer price index (cpi) for a fictional country from 1970 to 1980? a.) 1976 - 1978b.) 1972 - 1974c.) 1974 - 1976d.) 1978 - 1980
Answers: 1
Mathematics, 21.06.2019 18:00, lovemykay2355
If f(x) = 4x – 3 and g(x) = 8x + 2, find each function value a. f[g(3)] b. g[f(5)] c. g{f[g(-4)]}
Answers: 3
Mathematics, 21.06.2019 20:20, leximae2186
Consider the following estimates from the early 2010s of shares of income to each group. country poorest 40% next 30% richest 30% bolivia 10 25 65 chile 10 20 70 uruguay 20 30 50 1.) using the 4-point curved line drawing tool, plot the lorenz curve for bolivia. properly label your curve. 2.) using the 4-point curved line drawing tool, plot the lorenz curve for uruguay. properly label your curve.
Answers: 2
You know the right answer?
Questions in other subjects:

History, 25.02.2021 20:50


Mathematics, 25.02.2021 20:50
Mathematics, 25.02.2021 20:50


