Mathematics, 27.10.2020 16:30 ZaNiyahlove4711
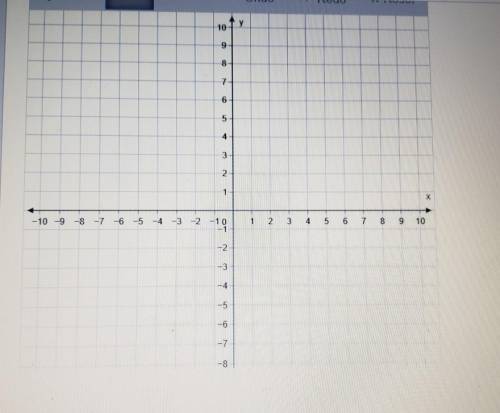
graph the function f(x) = - 1/3 x +1. The bottom of the graph goes to -10. Please show me where the points go on the graph on paper.


Answers: 1


Other questions on the subject: Mathematics

Mathematics, 21.06.2019 15:00, kkruvc
Ascatterplot is produced to compare the size of a school building to the number of students at that school who play an instrument. there are 12 data points, each representing a different school. the points are widely dispersed on the scatterplot without a pattern of grouping. which statement could be true
Answers: 1


You know the right answer?
graph the function f(x) = - 1/3 x +1. The bottom of the graph goes to -10. Please show me where the...
Questions in other subjects:


Chemistry, 04.09.2020 20:01


