
Mathematics, 27.10.2020 08:50 coollid876
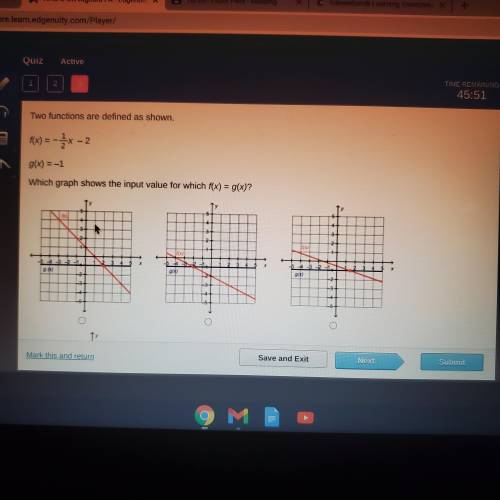
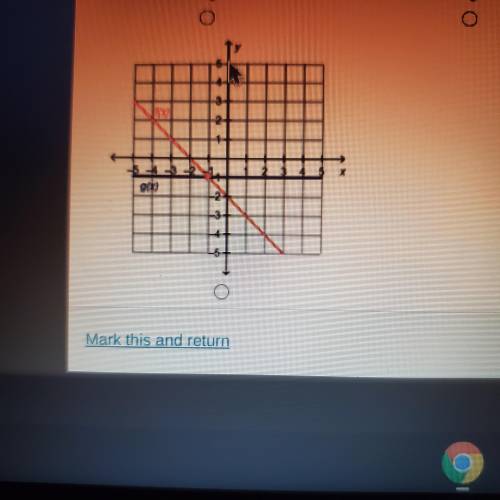
Two functions are defined as shown. f(x) = -1/2x-2 g(x) = -1. Which graph shows the input value for which f(x) = g(x)

Answers: 1


Other questions on the subject: Mathematics
Mathematics, 22.06.2019 01:30, KillerSteamcar
Jacob is graphing the line represented by the equation −6x−5y=12.−6x−5y=12. he first plots the x-x- and y-interceptsy-intercepts as follows. which statement is correct regarding the intercepts on the graph?
Answers: 1
You know the right answer?
Two functions are defined as shown. f(x) = -1/2x-2 g(x) = -1. Which graph shows the input value for...
Questions in other subjects:

Computers and Technology, 11.03.2021 20:30

Chemistry, 11.03.2021 20:30
Mathematics, 11.03.2021 20:30

English, 11.03.2021 20:30

Mathematics, 11.03.2021 20:30


