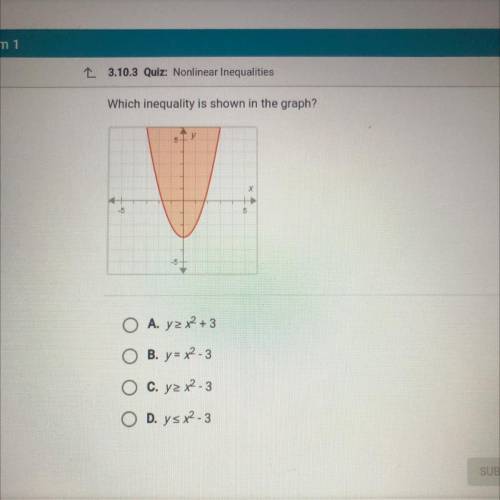
Which inequality is shown in the graph?
5
X
5
-5
O A. yz x2 + 3
B. y...

Mathematics, 26.10.2020 20:40 cjjohnson1221
Which inequality is shown in the graph?
5
X
5
-5
O A. yz x2 + 3
B. y = x2-3
O C. yz x2-3
O D. ys x2-3

Answers: 3


Other questions on the subject: Mathematics
Mathematics, 21.06.2019 22:30, Backfire3607
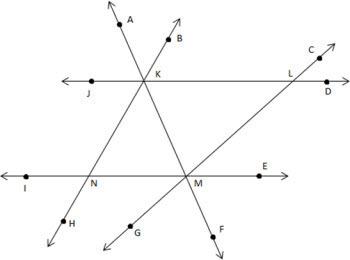
Using the figure below, select the two pairs of alternate interior angles. a: point 1 and point 4 b : point 2 and point 3 c: point 6 and point 6d: point 5 and point 7
Answers: 2
Mathematics, 21.06.2019 22:30, carltonwashington23
Julie was able to walk 16 km through the zoo in 6 hours. how long will it take her to walk 24 km through the zoo?
Answers: 2
Mathematics, 22.06.2019 00:30, sanfordl
1. according to the internal revenue service, the mean tax refund for the year 2007 was $2,708. assume the standard deviation is $650 and that the amounts refunded follow a normal probability distribution. a. what percent of the refunds are more than $3,000? b. what percent of the refunds are more than $3,000 but less than $4,000? c. what percent of the refunds are less than $2,000?
Answers: 2
You know the right answer?
Questions in other subjects:

English, 01.10.2019 20:00

History, 01.10.2019 20:00


