Calculating the mean: data displays
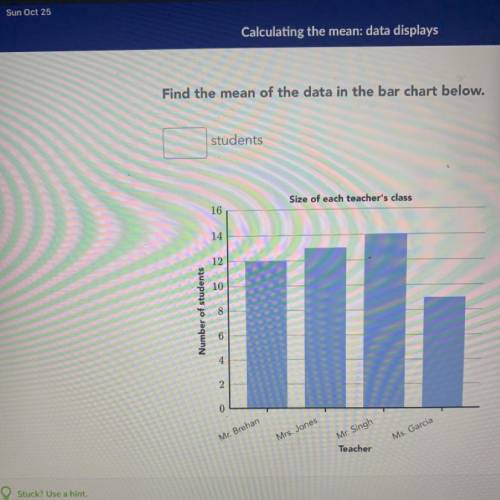
Find the mean of the data in the bar chart below.
student...

Mathematics, 26.10.2020 07:40 leah7378
Calculating the mean: data displays
Find the mean of the data in the bar chart below.
students
Size of each teacher's class
16
14
12
10
Number of students
8
6
4
SH
2.
0
Mr. Brehan
Mrs. Jones
Mr. Singh
Ms. Garcia

Answers: 3


Other questions on the subject: Mathematics
Mathematics, 21.06.2019 17:20, psychocatgirl1
Which system of linear inequalities is represented by the graph? + l tv x-3y > 6 and y > 2x o x + 3y > 6 and y o x-3y > 6 and y> 2x o x + 3y > 6 and y > 2x + 4 la +
Answers: 1
Mathematics, 21.06.2019 20:30, 2022maldonadoleonel
Your friend uses c=50p to find the total cost, c, for the people, p, entering a local amusement park what is the unit rate and what does it represent in the context of the situation?
Answers: 2
Mathematics, 21.06.2019 22:00, mileto1798
Write a description of each inequality. 1. -5a + 3 > 1 2. 27 - 2b < -6 (this < has a _ under it) 3. 1/2 (c + 1) > 5 (this > has a _ under it)
Answers: 3
Mathematics, 22.06.2019 02:10, Lkirjnnfcxd5039
Triangle xyz, with vertices x(-2, 0), y(-2, -1), and z(-5, -2), undergoes a transformation to form triangle x′y′z′, with vertices x′(4, -2), y′(4, -3), and z′(1, -4). the type of transformation that triangle xyz undergoes is a . triangle x′y′z′ then undergoes a transformation to form triangle x′y′z′, with vertices x″(4, 2), y″(4, 3), and z″(1, 4). the type of transformation that triangle x′y′z′ undergoes is a .
Answers: 1
You know the right answer?
Questions in other subjects:

Geography, 08.04.2021 01:00
Mathematics, 08.04.2021 01:00


Social Studies, 08.04.2021 01:00

English, 08.04.2021 01:00

Mathematics, 08.04.2021 01:00


