HELPME!!
Use the information to answer the following question.
the table shows the relationsh...

Mathematics, 25.10.2020 20:40 christyr2002
HELPME!!
Use the information to answer the following question.
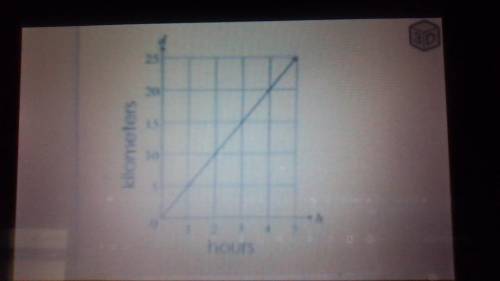
the table shows the relationship between the number of hours, h, jorge has been hiking
and the total distance, d, he has traveled in kilometers.
The graph shows the distance sara hiked over the same period of time.
who hikes faster?Explain.


Answers: 1


Other questions on the subject: Mathematics
Mathematics, 21.06.2019 22:00, ashhleyjohnson
After a dreary day of rain, the sun peeks through the clouds and a rainbow forms. you notice the rainbow is the shape of a parabola. the equation for this parabola is y = -x2 + 36. graph of a parabola opening down at the vertex 0 comma 36 crossing the x–axis at negative 6 comma 0 and 6 comma 0. in the distance, an airplane is taking off. as it ascends during take-off, it makes a slanted line that cuts through the rainbow at two points. create a table of at least four values for the function that includes two points of intersection between the airplane and the rainbow. analyze the two functions. answer the following reflection questions in complete sentences. what is the domain and range of the rainbow? explain what the domain and range represent. do all of the values make sense in this situation? why or why not? what are the x- and y-intercepts of the rainbow? explain what each intercept represents. is the linear function you created with your table positive or negative? explain. what are the solutions or solution to the system of equations created? explain what it or they represent. create your own piecewise function with at least two functions. explain, using complete sentences, the steps for graphing the function. graph the function by hand or using a graphing software of your choice (remember to submit the graph).
Answers: 2
You know the right answer?
Questions in other subjects:

Arts, 09.07.2019 08:00


Business, 09.07.2019 08:00

Social Studies, 09.07.2019 08:00
Biology, 09.07.2019 08:00


