
Mathematics, 24.10.2020 20:50 kate5582
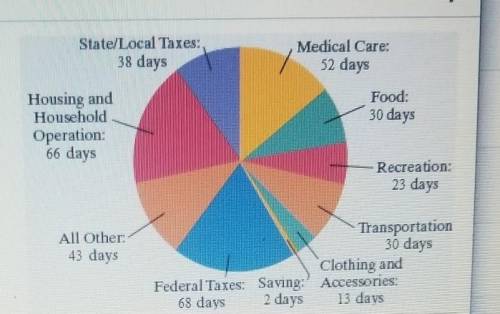
The circle graph shows a breakdown of spending for the average household using 365 days worked as a basis of comparison. What percentage of work time does the average household spend paying for housing and household operation? Housing and Household Operation : 66 days All Other 43 days % of work time. Paying for housing and household operation accounts for (Round to one decimal place as needed.)

Answers: 1


Other questions on the subject: Mathematics
Mathematics, 21.06.2019 21:50, zymikaa00
Scores on a university exam are normally distributed with a mean of 78 and a standard deviation of 8. the professor teaching the class declares that a score of 70 or higher is required for a grade of at least “c.” using the 68-95-99.7 rule, what percentage of students failed to earn a grade of at least “c”?
Answers: 1
You know the right answer?
The circle graph shows a breakdown of spending for the average household using 365 days worked as a...
Questions in other subjects:
Mathematics, 20.11.2020 01:40
Mathematics, 20.11.2020 01:40


English, 20.11.2020 01:40


History, 20.11.2020 01:40
Mathematics, 20.11.2020 01:40


