
Mathematics, 23.10.2020 22:50 masonbitterman2604
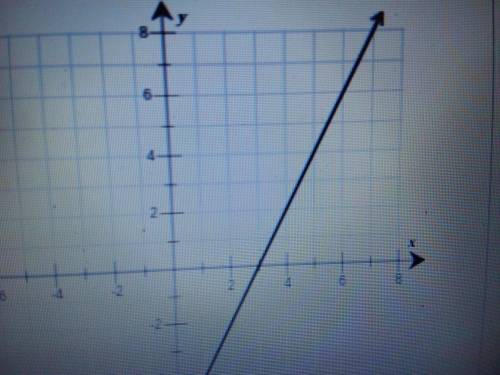
!!The graph of function f is shown on the coordinate plane. Graph the line representing function g, if g is defined as shown below.
g(x) = -1/2f(x + 2)
(sorry for the post's bad quality but if you can't tell, the x-intercept is 3, the y-intercept is -6 and the slope is 2

Answers: 2


Other questions on the subject: Mathematics
Mathematics, 21.06.2019 17:30, Vampfox
Monthly water bills for a city have a mean of $108.43 and a standard deviation of $32.09. find the probability that a randomly selected bill will have an amount greater than $155, which the city believes might indicate that someone is wasting water. would a bill that size be considered unusual?
Answers: 1
Mathematics, 21.06.2019 19:30, MariaIZweird7578
Combine the information in the problem and the chart using the average balance method to solve the problem.
Answers: 2
You know the right answer?
!!The graph of function f is shown on the coordinate plane. Graph the line representing function g,...
Questions in other subjects:

Mathematics, 05.05.2020 01:54
History, 05.05.2020 01:54
Mathematics, 05.05.2020 01:54

Mathematics, 05.05.2020 01:54


