Mathematics, 23.10.2020 20:20 ionutvasiliev4237
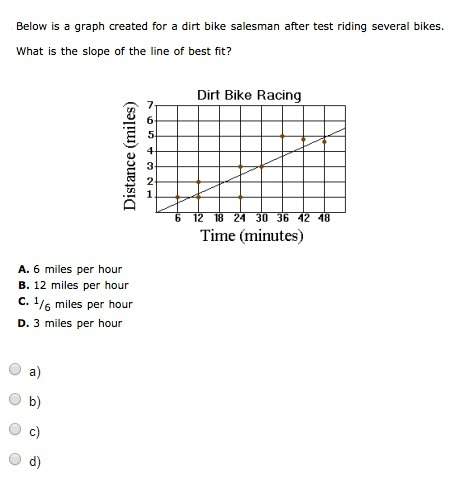
The scatter plot shows the time spent watching TV, X, and the time spent doing homework, y, by each of 25 students last week.
(a) Write an approximate equation of the line of best fit for the data. It doesn't have to be the exact line of best fit.
(b) Using your equation from part (a), predict the time spent doing homework for a student who spends 18 hours watching TV.
Note that you can use the graphing tools to help you approximate the line.

Answers: 2


Other questions on the subject: Mathematics

Mathematics, 21.06.2019 20:00, chantelporter713
Afamily has five members. a mom, a dad, two sisters, & a brother. the family lines up single file. what is the probabillity that the mom is at the front of the line
Answers: 1

Mathematics, 21.06.2019 20:30, GreenHerbz206
Tom is the deli manager at a grocery store. he needs to schedule employee to staff the deli department for no more that 260 person-hours per week. tom has one part-time employee who works 20 person-hours per week. each full-time employee works 40 person-hours per week. write and inequality to determine n, the number of full-time employees tom may schedule, so that his employees work on more than 260 person-hours per week. graph the solution set to this inequality.
Answers: 1

Mathematics, 22.06.2019 01:00, chandranewlon
Ellie spent $88.79 at the computer stote. she had $44.50 left to buy a cool hat. how much money did she originally have? write and solve an equation to answer the question.
Answers: 2

Mathematics, 22.06.2019 02:00, citlalli30
Sammie has 3 times as many goldfish as nora. nora has 4 goldfish. how many goldfish do sammie and nora have in all?
Answers: 2
You know the right answer?
The scatter plot shows the time spent watching TV, X, and the time spent doing homework, y, by each...
Questions in other subjects:


History, 25.04.2020 01:57

Mathematics, 25.04.2020 01:57

History, 25.04.2020 01:57


