
Mathematics, 23.10.2020 19:50 sanjanadevaraj26
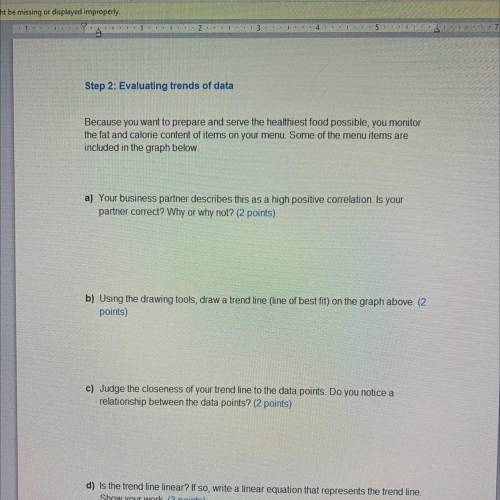
Step 2: Evaluating trends of data
Because you want to prepare and serve the healthiest food possible, you monitor
the fat and calorie content of items on your menu. Some of the menu items are
included in the graph below.
a) Your business partner describes this as a high positive correlation. Is your
partner correct? Why or why not? (2 points)
b) Using the drawing tools, draw a trend line (line of best fit) on the graph above. (2
points)
c) Judge the closeness of your trend line to the data points. Do you notice a
relationship between the data points? (2 points)
d) is the trend line linear? If so, write a linear equation that represents the trend line.
Show your work. (3 points)

Answers: 3


Other questions on the subject: Mathematics
Mathematics, 21.06.2019 16:30, Hfruit
You drop a rubber ball off the roof of a 50 meter high building onto a paved parking lot. it bounces back up with every bounce, but not quite all the way back up to you. after the first bounce it bounces back only 80 percent of the distance it was dropped from. the pattern continues, meaning after every bounce it comes up to just 80 percent of the previous maximum height. so if before the first bounce the height is 50 meters, what height does the ball reach after the fifth bounce? round your answer to one decimal place and chose the correct response from the choices below:
Answers: 1
You know the right answer?
Step 2: Evaluating trends of data
Because you want to prepare and serve the healthiest food possibl...
Questions in other subjects:


Mathematics, 28.05.2020 17:57
English, 28.05.2020 17:57

English, 28.05.2020 17:57

Chemistry, 28.05.2020 17:57
English, 28.05.2020 17:57


