Mathematics, 23.10.2020 19:20 musiclyhollywoodbabo
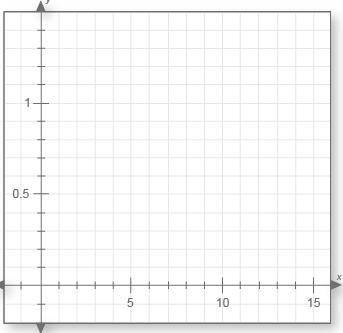
Label the axes of the graph with "Time (hours)" and "Energy (kWh)." Plot the points from table A on the graph. Connect the points with a line. On the same graph, plot the points from table B and connect them with a line. I need help!!


Answers: 3


Other questions on the subject: Mathematics

Mathematics, 21.06.2019 12:30, Bra1nPowers
If a(0,0,0) and b(2,2,2) are points in coordinate space, how many paths are there from a to b that move from one lattice point to another in the positive x-,y- or z- direction?
Answers: 2


Mathematics, 21.06.2019 18:00, leianagaming
Describe the relationship between the angles of similar triangles and the sides of similar triangles
Answers: 1

Mathematics, 21.06.2019 20:00, michelle5642b
Find all solutions for 2y - 4x =2 y = 2x + 1 site: socratic. org
Answers: 1
You know the right answer?
Label the axes of the graph with "Time (hours)" and "Energy (kWh)." Plot the points from table A on...
Questions in other subjects:


Mathematics, 20.07.2021 03:10


