
Mathematics, 23.10.2020 17:20 caprisun1440
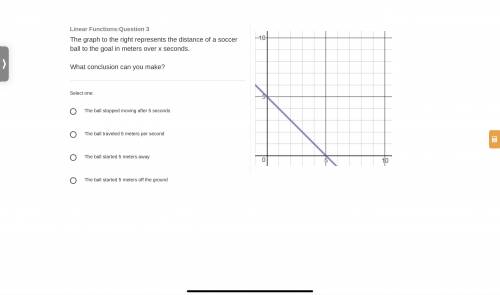
The graph to the right represents the distance of a soccer ball to the goal in meters over x seconds. What conclusion can you make?

Answers: 2


Other questions on the subject: Mathematics
Mathematics, 21.06.2019 20:00, yesseniaroman21
Pepe and leo deposits money into their savings account at the end of the month the table shows the account balances. if there pattern of savings continue and neither earns interest nor withdraw any of the money , how will the balance compare after a very long time ?
Answers: 1
Mathematics, 21.06.2019 21:00, cjgonzalez981
Type the correct answer in each box. use numerals instead of words. if necessary, use / fir the fraction bar(s). the graph represents the piecewise function: h
Answers: 3
Mathematics, 21.06.2019 21:30, aniacopenowell7
How many terms does the polynomial x^2 y^2 have
Answers: 1
You know the right answer?
The graph to the right represents the distance of a soccer ball to the goal in meters over x seconds...
Questions in other subjects:
Mathematics, 24.02.2021 17:20
Mathematics, 24.02.2021 17:20

Chemistry, 24.02.2021 17:20
Mathematics, 24.02.2021 17:20
Chemistry, 24.02.2021 17:20
Mathematics, 24.02.2021 17:20

English, 24.02.2021 17:20


