Which inequality is represented by this graph?
-5 -4 -3 -2 -1 0 1 2 3 4 5
0 0 > X
O...

Mathematics, 23.10.2020 17:20 mjlchance367
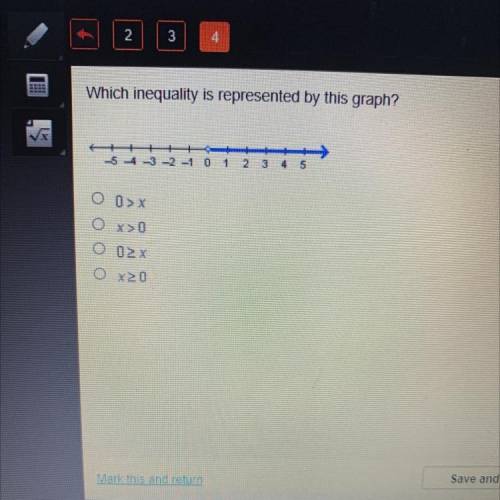
Which inequality is represented by this graph?
-5 -4 -3 -2 -1 0 1 2 3 4 5
0 0 > X
O x > 0
Plz hurry this is timed

Answers: 1


Other questions on the subject: Mathematics
Mathematics, 21.06.2019 21:30, cdvazquez727
The box plots show the average speeds, in miles per hour, for the race cars in two different races. which correctly describes the consistency of the speeds of the cars in the two races?
Answers: 3
Mathematics, 21.06.2019 22:30, carltonwashington23
Julie was able to walk 16 km through the zoo in 6 hours. how long will it take her to walk 24 km through the zoo?
Answers: 2
Mathematics, 21.06.2019 22:40, jeffyisdrunk
The value of x in this system of equations is 1. 3x + y = 9 y = –4x + 10 substitute the value of y in the first equation: combine like terms: apply the subtraction property of equality: apply the division property of equality: 3x + (–4x + 10) = 9 –x + 10 = 9 –x = –1 x = 1 what is the value of y?
Answers: 1
Mathematics, 22.06.2019 00:30, braydenmcd02
Hi i’m not sure how to do question 20 if u could explain how to do it that’d b great
Answers: 1
You know the right answer?
Questions in other subjects:


Biology, 05.02.2020 01:02

Social Studies, 05.02.2020 01:02


Mathematics, 05.02.2020 01:02


