1
Select the correct answer.
Y
8
6
2
-
X
-4-2
21
16
4
6
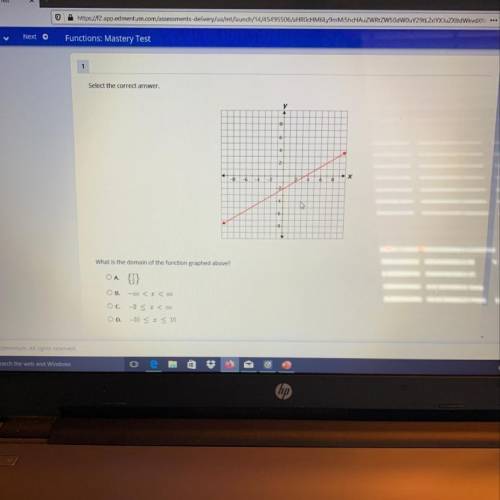
What is the domain of the function graphed above?
On 1]
OB
-00
Ос.
-2 < I< 00
OD
-10 SI 3 10
2020 Edmentum All rights reserved
The stem-and-leaf plot shows the heights in centimeters of teddy bear sunflowers grown in two different types of soil. soil a soil b 5 9 5 2 1 1 6 3 9 5 1 0 7 0 2 3 6 7 8 2 1 8 3 0 9 key: 9|6 means 69 key: 5|8 means 58 calculate the mean of each data set. calculate the mean absolute deviation (mad) of each data set. which set is more variable? how do you know?