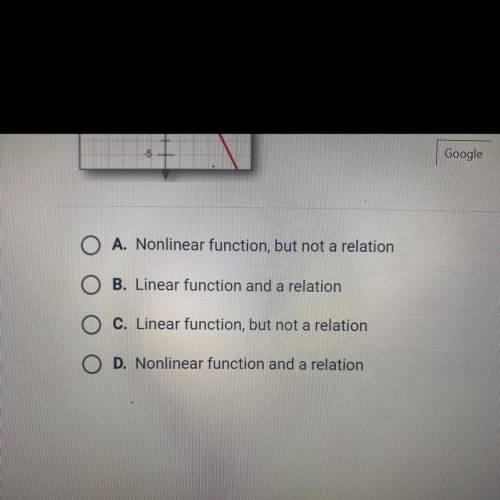
Classify the graph as a linear function non linear function or relation
...

Mathematics, 23.10.2020 02:01 leapfroggiez
Classify the graph as a linear function non linear function or relation

Answers: 1


Other questions on the subject: Mathematics
Mathematics, 21.06.2019 19:00, lex112592
Samantha is growing a garden in her back yard. she spend $90 setting up the garden bed and buying the proper garden supplies. in addition, each seed she plants cost $0.25. a. write the function f(x) that represents samantha's total cost on her garden. b. explain what x represents. c. explain what f(x) represents. d. if samantha plants 55 seeds, how much did she spend in total?
Answers: 2
Mathematics, 21.06.2019 19:10, alarconanais07
Labc is reflected across x = 1 and y = -3. what are the coordinates of the reflection image of a after both reflections?
Answers: 3
Mathematics, 21.06.2019 23:30, claytonhopkins
In a study of the relationship between socio-economic class and unethical behavior, 129 university of california undergraduates at berkeley were asked to identify themselves as having low or high social-class by comparing themselves to others with the most (least) money, most (least) education, and most (least) respected jobs. they were also presented with a jar of individually wrapped candies and informed that the candies were for children in a nearby laboratory, but that they could take some if they wanted. after completing some unrelated tasks, participants reported the number of candies they had taken. it was found that those who were identiď¬ed as upper-class took more candy than others. in this study, identify: (a) the cases, (b) the variables and their types, (c) the main research question, (d) identify the population of interest and the sample in this study, and (e) comment on whether or not the results of the study can be generalized to the population, and if the ď¬ndings of the study can be used to establish causal relationships.
Answers: 2
You know the right answer?
Questions in other subjects:
Mathematics, 03.09.2019 00:10
Mathematics, 03.09.2019 00:10
Mathematics, 03.09.2019 00:10
Mathematics, 03.09.2019 00:10


