
Mathematics, 22.10.2020 21:01 sabrikat
Please help me, I really dont want to get an F :((( (The Graph Is In The Image)
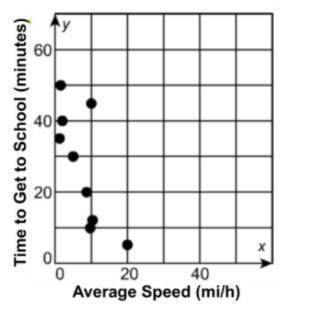
The graph shows the data for the time it takes Jerome to bike to school, based on his average biking speed for that trip. Which sentence describes the association?
A. The speed he bikes at affects the time it take him to get to school, but it is unclear if the time increases or decreases.
B. As the average speed increases, the time he takes to get to school decreases.
C. The speed he bikes at does not affect the time it takes him to get to school.
D. As the average speed increases, so does the time he takes to get to school.

Answers: 1


Other questions on the subject: Mathematics
Mathematics, 21.06.2019 16:30, emilyanneK2540
Jackie purchased 3 bottles of water and 2 cups of coffee for a family for $7.35. brian bought 4 bottles of water and 1 cup of coffee for his family for $7.15. how much does each bottle of water cost? how much does each cup of coffee cost? i need this done
Answers: 3
Mathematics, 21.06.2019 19:00, ale1910
Quick! a survey of 57 customers was taken at a bookstore regarding the types of books purchased. the survey found that 33 customers purchased mysteries, 25 purchased science fiction, 18 purchased romance novels, 12 purchased mysteries and science fiction, 9 purchased mysteries and romance novels, 6 purchased science fiction and romance novels, and 2 purchased all three types of books. a) how many of the customers surveyed purchased only mysteries? b) how many purchased mysteries and science fiction, but not romance novels? c) how many purchased mysteries or science fiction? d) how many purchased mysteries or science fiction, but not romance novels? e) how many purchased exactly two types of books?
Answers: 3
Mathematics, 21.06.2019 23:00, ronaldotheexplorer12
The ratio of the perimeters of two similar triangles is 4: 3. what are the areas of these triangles if the sum of their areas is 130cm2?
Answers: 3
You know the right answer?
Please help me, I really dont want to get an F :((( (The Graph Is In The Image)
The graph shows the...
Questions in other subjects:

English, 23.03.2021 05:30
Mathematics, 23.03.2021 05:30
Mathematics, 23.03.2021 05:30

Physics, 23.03.2021 05:30
English, 23.03.2021 05:30
Mathematics, 23.03.2021 05:30


