
Mathematics, 22.10.2020 21:01 vero5047
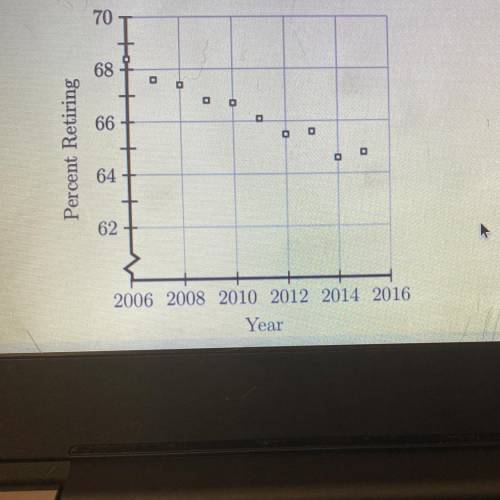
The scatterplot shown below represents data for each of the years from 2006
to 2015. The plot shows the percent of people 62 years of age and older who
were working and then retired during each of those years. If this trend continued
which of the following best predicts the percent who retired in 2016?

Answers: 2


Other questions on the subject: Mathematics
Mathematics, 21.06.2019 20:30, kjhgfcvb5761
Solve each quadratic equation by factoring and using the zero product property. [tex]x^2+6x+8=0[/tex]
Answers: 2
Mathematics, 21.06.2019 23:00, teriateria
How can writing phrases as algebraic expressions you solve problems?
Answers: 2
You know the right answer?
The scatterplot shown below represents data for each of the years from 2006
to 2015. The plot shows...
Questions in other subjects:

Arts, 06.05.2021 19:10

English, 06.05.2021 19:10

Mathematics, 06.05.2021 19:10
English, 06.05.2021 19:10
English, 06.05.2021 19:10


Chemistry, 06.05.2021 19:10


