
Mathematics, 22.10.2020 17:01 karenlemus4774
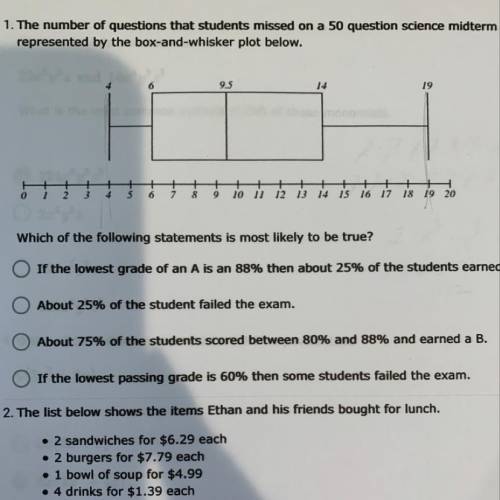
1. The number of questions that students missed on a 50 question science midterm is
represented by the box-and-whisker plot below.
Which of the following statements is most likely to be true?
If the lowest grade of an A is an 88% then about 25% of the students earned an A.
About 25% of the student failed the exam.
About 75% of the students scored between 80% and 88% and earned a B.
If the lowest passing grade is 60% then some students failed the exam.

Answers: 3


Other questions on the subject: Mathematics
Mathematics, 21.06.2019 17:30, bradleycawley02
Lems1. the following data set represents the scores on intelligence quotient(iq) examinations of 40 sixth-grade students at a particular school: 114, 122, 103, 118, 99, 105, 134, 125, 117, 106, 109, 104, 111, 127,133, 111, 117, 103, 120, 98, 100, 130, 141, 119, 128, 106, 109, 115,113, 121, 100, 130, 125, 117, 119, 113, 104, 108, 110, 102(a) present this data set in a frequency histogram.(b) which class interval contains the greatest number of data values? (c) is there a roughly equal number of data in each class interval? (d) does the histogram appear to be approximately symmetric? if so, about which interval is it approximately symmetric?
Answers: 3
Mathematics, 21.06.2019 19:30, robert7248
I'm confused on this could anyone me and show me what i need to do to solve it.
Answers: 1
Mathematics, 21.06.2019 19:30, danielahchf
Ineed with angles and the measure of them i have abc a is 65 and b is (3x-10) and c is (2x) find the value of x
Answers: 2
You know the right answer?
1. The number of questions that students missed on a 50 question science midterm is
represented by...
Questions in other subjects:
Mathematics, 27.09.2019 11:20


Biology, 27.09.2019 11:20

Social Studies, 27.09.2019 11:20
Mathematics, 27.09.2019 11:20

Business, 27.09.2019 11:20
Biology, 27.09.2019 11:20


