
Mathematics, 22.10.2020 16:01 marahsenno
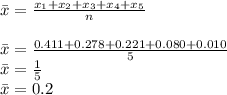
The histogram shows the distribution of hurricanes that have hit a country from 1851 through 2015, where 1 is the weakest level and 5 is the strongest level.
1= 0.411
2=0.278
3=0.221
4=0.080
5=0.010
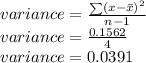
(a) Find the mean, variance and standard deviation of the probability distribution.
(b) Interpret the results: A, B, C or D.
A. The average hurricane is aprox. category 1.
B. The average hurricane is aprox. category 2.*
C. Most of the hurricane sizes differ from the average by about 2 or 3.
D. Most of the hurricane sized differ from the average by about 1 or 2.*

Answers: 3
 )
)


Other questions on the subject: Mathematics
Mathematics, 21.06.2019 19:10, chrischris1
In the triangles, bc =de and ac fe. if the mzc is greater than the mze, then ab isdfelth
Answers: 2
Mathematics, 21.06.2019 20:20, bbyjoker
Recall that the owner of a local health food store recently started a new ad campaign to attract more business and wants to know if average daily sales have increased. historically average daily sales were approximately $2,700. the upper bound of the 95% range of likely sample means for this one-sided test is approximately $2,843.44. if the owner took a random sample of forty-five days and found that daily average sales were now $2,984, what can she conclude at the 95% confidence level?
Answers: 1
Mathematics, 21.06.2019 21:40, ur4286
Scores on the cognitive scale of the bayley-scales of infant and toddler development range from 1 to 19, with a standard deviation of 3. calculate the margin of error in estimating the true mean cognitive scale score, with 99% confidence, if there are 12 infants and toddlers in a sample.
Answers: 3
You know the right answer?
The histogram shows the distribution of hurricanes that have hit a country from 1851 through 2015, w...
Questions in other subjects:

Computers and Technology, 31.07.2019 20:30


History, 31.07.2019 20:30


Biology, 31.07.2019 20:30
Biology, 31.07.2019 20:30


