
Mathematics, 22.10.2020 05:01 Haleysaraya1
20 POINTS
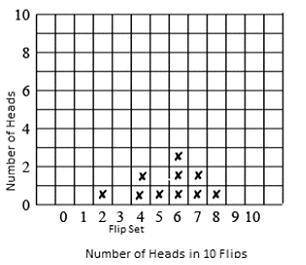
1. Draw a histogram from all the data. Starting at the bottom row, for each set of 10 flips, place an "x" in the column corresponding to the number of heads that set produced. Your histogram should look similar to the example below:
2. Calculate the mean and standard deviation. mean = _, standard deviation = _
3. Calculate the percent of the data that is within 1, 2, and 3 standard deviations of the mean. within
1 standard deviation = _% within
2 standard deviations = _% within
3 standard deviations = _%
4. Compare your results to a normal distribution. Interpret any differences.

Answers: 1


Other questions on the subject: Mathematics
Mathematics, 21.06.2019 16:40, elizabethwaller8104
Identify an equation in point slope form for the line perpendicular to y=3x+5 that passes through (4,-1)
Answers: 2
Mathematics, 21.06.2019 18:30, perezsamantha3oqr0za
(05.08a)triangle abc is transformed to similar triangle a′b′c′ below: a coordinate plane is shown. triangle abc has vertices a at 2 comma 6, b at 2 comma 4, and c at 4 comma 4. triangle a prime b prime c prime has vertices a prime at 1 comma 3, b prime at 1 comma 2, and c prime at 2 comma 2. what is the scale factor of dilation? 1 over 2 1 over 3 1 over 4 1 over 5
Answers: 3
Mathematics, 21.06.2019 18:30, genyjoannerubiera
Isuck at math ; ^; m a student solved this problem and said the answer is 3 feet. chase had a roll of ribbon that contained 7 7/8 feet of ribbon. he cut off one piece that was 3 5/8 feet long and another piece that was 1 1/4 feet from the roll. how much ribbon was left on the roll? is the student's answer reasonable? yes, the answer is reasonable. no, the answer is not reasonable. it should be about 2 feet. no, the answer is not reasonable. it should be about 13 feet. no, the answer is not reasonable. it should be about 4 feet.
Answers: 1
Mathematics, 21.06.2019 20:30, alexialiles19
Max recorded the heights of 500 male humans. he found that the heights were normally distributed around a mean of 177 centimeters. which statements about max’s data must be true? a) the median of max’s data is 250 b) more than half of the data points max recorded were 177 centimeters. c) a data point chosen at random is as likely to be above the mean as it is to be below the mean. d) every height within three standard deviations of the mean is equally likely to be chosen if a data point is selected at random.
Answers: 2
You know the right answer?
20 POINTS
1. Draw a histogram from all the data. Starting at the bottom row, for each set of 10 fli...
Questions in other subjects:

Mathematics, 18.03.2021 03:10

English, 18.03.2021 03:10
Mathematics, 18.03.2021 03:10
Mathematics, 18.03.2021 03:10

Mathematics, 18.03.2021 03:10


