 and
and  is represented by,
 = 3
= 3
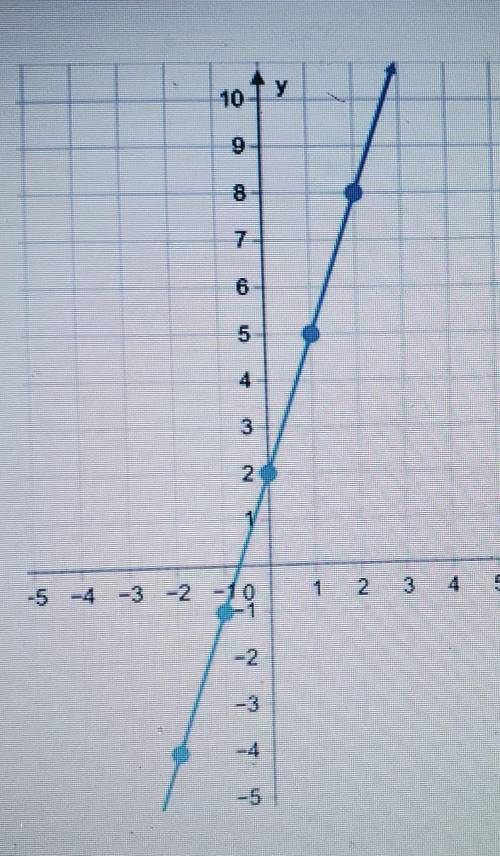
What equation is graphed in this figure?
y-4= = -⅓(x+2)
y-3= ⅓(x + 1)
y+ 2 = -3(x - 1) <...

Mathematics, 22.10.2020 01:01 zoeyjorschumb17
What equation is graphed in this figure?
y-4= = -⅓(x+2)
y-3= ⅓(x + 1)
y+ 2 = -3(x - 1)
y - 5 = 3 (x - 1)

Answers: 3


Other questions on the subject: Mathematics
Mathematics, 22.06.2019 01:40, Anshuman2002
(co 3) the soup produced by a company has a salt level that is normally distributed with a mean of 5.4 grams and a standard deviation of 0.3 grams. the company takes readings of every 10th bar off the production line. the reading points are 5.8, 5.9, 4.9, 6.5, 5.0, 4.9, 6.2, 5.1, 5.7, 6.1. is the process in control or out of control and why? it is out of control as two of these data points are more than 2 standard deviations from the mean it is in control as the data points more than 2 standard deviations from the mean are far apart it is out of control as one of these data points is more than 3 standard deviations from the mean it is in control as the values jump above and below the mean
Answers: 2
Mathematics, 22.06.2019 03:30, lydia309
Millie decided to purchase a $17,000 msrp vehicle at a 4% interest rate for 6 years. the dealership offered her a $2700 cash-back incentive, which she accepted. if she takes all these factors into consideration, what monthly payment amount can she expect? a.$223.73b.$243.25c.$274.61d.$2 35.51
Answers: 1
You know the right answer?
Questions in other subjects:

Mathematics, 05.03.2021 18:40


Social Studies, 05.03.2021 18:40


