
Mathematics, 21.10.2020 20:01 marquezbell6577
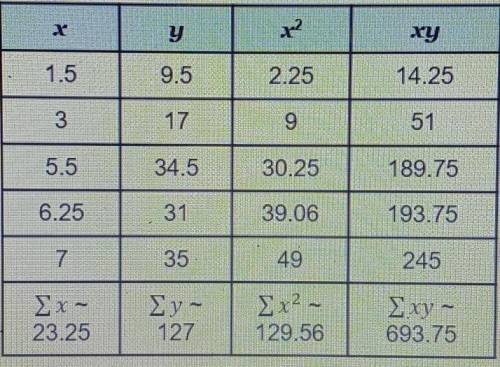
The table shows the relationship between the number of trucks filled with mulch (x) and the number of tons of mulch (y) delivered by a landscaping company. Which regression equation models the data?
A. y = 4.8x + 3
B. y = 3x + 4.8
C. y = x + 20.8
D. y = 20.8x + 1

Answers: 3


Other questions on the subject: Mathematics
Mathematics, 21.06.2019 15:00, yyyyyyyyy8938
Sienna planned a trapezoid-shaped garden, as shown in the drawing below. she decides to change the length of the top of the trapezoid-shaped garden from 32 ft to 24 ft. which expression finds the change in the scale factor?
Answers: 1
Mathematics, 21.06.2019 16:30, sydthekid9044
Divide the following fractions 3/4 ÷ 2/3 1/2 8/9 9/8 2
Answers: 2
Mathematics, 21.06.2019 18:30, Katlyndavis01
What is the answer to this question? i'm a bit stumped. also how do i do it? 5(x - 4) = 2(x + 5)
Answers: 1
Mathematics, 21.06.2019 20:00, haileyhale5
What are the domain and range of the function f(x)=2^x+1
Answers: 1
You know the right answer?
The table shows the relationship between the number of trucks filled with mulch (x) and the number o...
Questions in other subjects:

Mathematics, 20.05.2021 16:30
Mathematics, 20.05.2021 16:30
Mathematics, 20.05.2021 16:30

Health, 20.05.2021 16:30

History, 20.05.2021 16:30

Computers and Technology, 20.05.2021 16:30


