What is true of the data in the dot plot? Check all that apply
A. The center is 13.
B. T...

Mathematics, 21.10.2020 20:01 maggiekilgore1
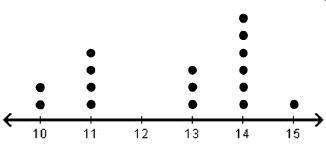
What is true of the data in the dot plot? Check all that apply
A. The center is 13.
B. The center is 14.
C. The peak is at 14.
D. It has two clusters.
E. It is skewed left.
F. The spread is from 13 to 15.
G. The person waited for the bus 16 times.
Number of Minutes Shelly Spent Waiting for the Bus Each Morning

Answers: 1


Other questions on the subject: Mathematics
Mathematics, 21.06.2019 19:30, tyeni2crazylolp7a3hk
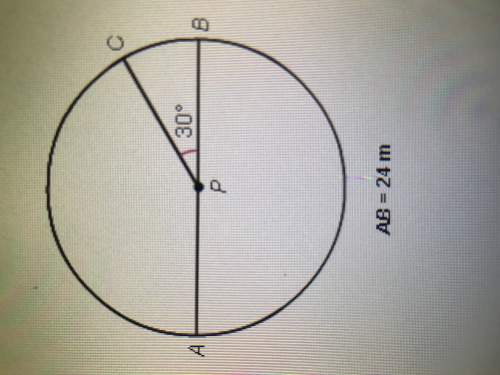
If chord ab is congruent to chord cd, then what must be true about ef and eg?
Answers: 1
Mathematics, 22.06.2019 00:30, autumnmeadows20
Officer brimberry wrote 32 tickets for traffic violations last week, but only 4 tickets this week. what is the percent decrease? give your answer to the nearest tenth of a percent.
Answers: 1
Mathematics, 22.06.2019 02:00, nadinealonzo6121
Identify the percent of change as an increase or a decrease. 75 people to 25 people response - correct increase decrease question 2 find the percent of change. round to the nearest tenth of a percent.
Answers: 3
Mathematics, 22.06.2019 03:00, lucypackham9
(: the two box-and- whisker plots below show the scores on a math exam for two classes. what 2 things do the interquartile range tell you about the two classes?
Answers: 2
You know the right answer?
Questions in other subjects:


Computers and Technology, 11.05.2021 19:20

Physics, 11.05.2021 19:20
Mathematics, 11.05.2021 19:20

Arts, 11.05.2021 19:20
Mathematics, 11.05.2021 19:20


