
Mathematics, 21.10.2020 06:01 bricksaspares
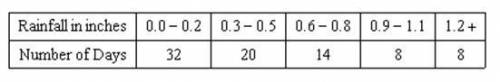
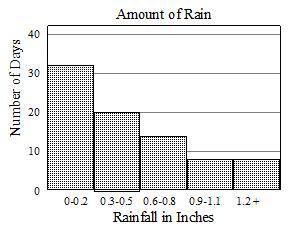
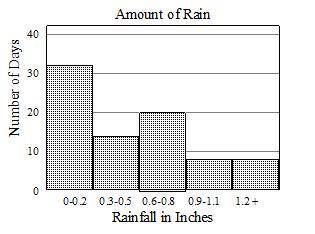
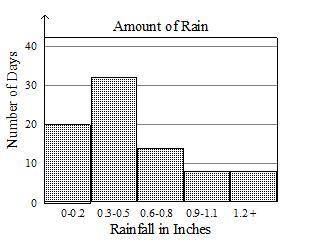
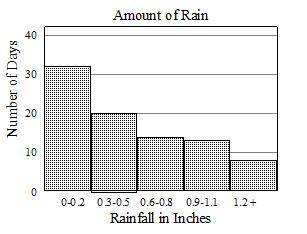
The frequency table shows the rainfall amounts over a three-month period on Carlsville. Which of the following histograms accurately represents this data?

Answers: 1


Other questions on the subject: Mathematics
Mathematics, 21.06.2019 20:10, jaidencoolman2866
In the diagram, points d and e are marked by drawing arcs of equal size centered at b such that the arcs intersect ba and bc. then, intersecting arcs of equal size are drawn centered at points d and e. point p is located at the intersection of these arcs. based on this construction, m , and m
Answers: 1
Mathematics, 21.06.2019 20:40, jaydenrobinettewca
Ineed someone to me answer my question i have to have this done and knocked out
Answers: 2
Mathematics, 21.06.2019 21:10, cheyennemitchel238
What is the equation of a line passing through (-6,5) and having a slope of 1/3
Answers: 3
You know the right answer?
The frequency table shows the rainfall amounts over a three-month period on Carlsville.
Which of th...
Questions in other subjects:


Social Studies, 12.01.2021 01:40

English, 12.01.2021 01:40
Mathematics, 12.01.2021 01:40
Social Studies, 12.01.2021 01:40

Business, 12.01.2021 01:40

Biology, 12.01.2021 01:40
Mathematics, 12.01.2021 01:40


