
Mathematics, 21.10.2020 01:01 charismameeks
AP Statistics teachers from across the country meet annually in Kansas City to score AP Statistics
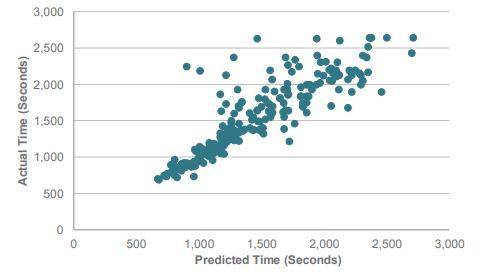
exams. One social event that many teachers participate in is the annual Prediction Fun Run. Prior to the
race, the teachers predict how long it will take them to complete the 1.96-mile long course. During the
event, they are timed and their actual finishing times are paired with their predicted times. Here is a
scatterplot of the results.
The winner of the race is not the fastest runner, but the most accurate runner.
a) Let x = the runner’s predicted time (in seconds) and y = the runner’s actual time (in seconds).
Provide the equation of the line that can be used to assess how accurate the runners were. Plot
this line on the graph above. Clearly label two points you are using to plot the line.
b) Is the line you drew in part (a) a least-squares regression line for these data? Explain.
c) While many runners were quite good at predicting their race time, some runners did very poorly at
this task. Circle the point of the runner who had the largest error in prediction. Justify your choice.
Was this runner faster or slower than predicted?
d) Describe the relationship between predicted time and actual time. Are all runners able to predict
their actual times approximately equally well?

Answers: 3


Other questions on the subject: Mathematics
Mathematics, 21.06.2019 13:00, brialevy2283
Find the total area for the regular pyramid ( follow the answer set up in the picture)
Answers: 1
Mathematics, 21.06.2019 13:00, innocentman69
You are constructing a histogram for scores that range from 70 to 100 in whole points. frequencies range from 3 to 10; that is, every whole-point score between 60 and 100 occurs at least 3 times, and at least one score occurs 10 times. which of these would probably be the best range and size for the score intervals along the x-axis?
Answers: 1
Mathematics, 21.06.2019 14:00, AnaiyaKirksey8
Find the area of a trapezoid with bases 14 cm and 18 cm and height 10 cm. 160 cm2 140 cm2 180 cm2 126 cm2
Answers: 3
Mathematics, 21.06.2019 19:00, tylerwayneparks
Solving systems of linear equations: tables represent two linear functions in a systemöwhat is the solution to this system? 0 (10)0 (1.6)0 18,26)0 18-22)
Answers: 1
You know the right answer?
AP Statistics teachers from across the country meet annually in Kansas City to score AP Statistics...
Questions in other subjects:

History, 27.06.2019 05:10


Social Studies, 27.06.2019 05:10


