
Mathematics, 21.10.2020 01:01 lewisf5929
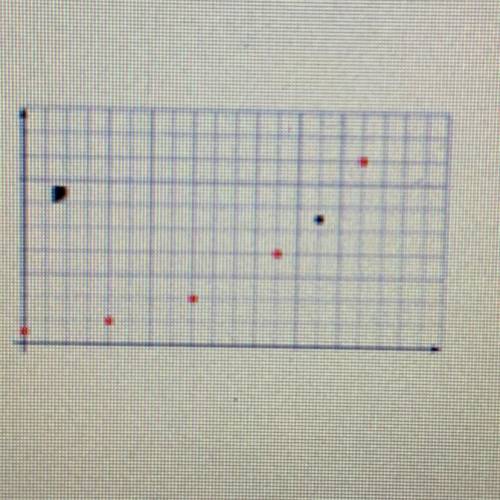
The graph show the population of beavers in a forest for different numbers of years after
1995. The beaver population is growing exponentially.
1. Explain why we can think of the beaver population as a function of time in years.
2.
What is the meaning of the point labeled Q in this context?
3.Write an equation using function notation to represent this situation.

Answers: 3


Other questions on the subject: Mathematics
You know the right answer?
The graph show the population of beavers in a forest for different numbers of years after
1995. The...
Questions in other subjects:

English, 24.10.2020 04:30


History, 24.10.2020 04:30
Mathematics, 24.10.2020 04:30
Mathematics, 24.10.2020 04:30

Computers and Technology, 24.10.2020 04:30


