
Mathematics, 20.10.2020 09:01 gabrielaperezcz
I. Collect data from several fast food chains on the number of fat calories and grams of saturated fat in menu items. Record at least 12 ordered pairs of (fat calories, grams of saturated fat). Organize your data in a table.
II. Make a scatter plot of the data on graph paper. Be sure to label the axes and use an appropriate title for the graph.
You may wish to use a graphing calculator, spread sheet, or other technology resource (such as the graphing utility link below) to aid you in graphing.
Create a Graph
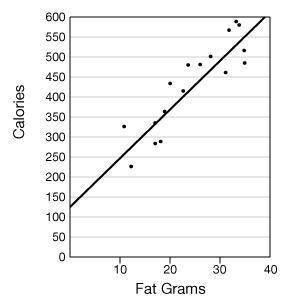
III. Draw a trend line for the scatter plot. Use the following scatter plot of the ordered pairs (fat grams, total calories) as an example.
IV. Calculate the slope of the trend line. (Choose two points on the line and find vertical change over horizontal change.)
Note: Graphing calculators and spread sheets have features with which to draw trend lines and determine the equation. You may choose to use one of these options. If you use technology, indicate what steps were taken to arrive at your equation.
V. Using the slope and y-intercept, write the equation of the trend line ( y = mx + b).
VI. Choose a "calories from fat" value that is not in your collected data set and that is at least 10 fat calories away from any collected value. Use the equation calculated in step V to predict the number of fat grams in an item having that number of fat calories. Be sure to show your work.
VII. Search for an item in a fast food menu having the same number of fat calories as the one you chose above. (If you cannot find the exact value, get as close as you can.) Compare the calculated value from step VI to this actual value. Explain why (or why not) you would have expected your prediction (calculated value) to be close to the actual value.

Answers: 3


Other questions on the subject: Mathematics
Mathematics, 21.06.2019 16:30, wolfygamer14
The angles below are supplementary. what is the value of x? a pair of supplementary angles is shown. one angle measures 7x + 33, and the other angle measures 70. 5.3 8.14 11 14.7
Answers: 1
Mathematics, 21.06.2019 17:50, aaroncx4900
Jace wrote a sentence as an equation. 56 is 14 more than a number. 14+ = 56 which statement best describes jace's work? jace is not correct. the phrase more than suggests using the symbol > and jace did not use that symbol. jace is not correct. he was correct to use addition, but the equation should be 56+ p = 14 jace is not correct. the first number in the sentence is 56, so the equation should start with 56. jace is correct. the phrase more than suggests addition, so jace showed that 14 plus a variable equals 56. o
Answers: 1
Mathematics, 21.06.2019 21:30, bjbass899
40) linda was making chocolate truffles for the first day of school. the recipe for 20 chocolate truffles is: i cup of cream 2 cups of dark chocolate she noticed this will not be enough truffles for the 42 sure that all students in each homeroom next year. to be sure that all students receive a truffle, linda must adjust her recipe. a. complete the recipe for 42 truffles cups of cream - cups of dark chocolate work:
Answers: 2
You know the right answer?
I. Collect data from several fast food chains on the number of fat calories and grams of saturated f...
Questions in other subjects:


Mathematics, 03.11.2020 17:00


