
Mathematics, 20.10.2020 04:01 shyiann7910
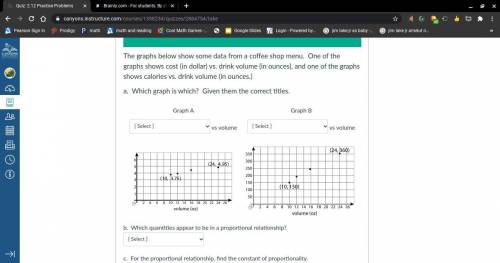
The graphs below show some data from a coffee shop menu. One of the graphs shows cost (in dollar) vs. drink volume (in ounces), and one of the graphs shows calories vs. drink volume (in ounces.)
a. Which graph is which? Given them the correct titles.
Graph A: _vs volume. Graph B:_vs volume
b. Which quantities appear to be in a proportional relationship?
1. cost vs volume or
2. calories vs volume
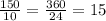
For the proportional relationship, find the constant of proportionality.
a. 0.21 per ounce,
b. 12 calories per ounce,
c. 0.38$ per ounce, or
d. 15 calories per ounce

Answers: 3


Other questions on the subject: Mathematics
Mathematics, 21.06.2019 22:30, clickbaitdxl
Pls never taught i’m really confused and i rlly need
Answers: 1
Mathematics, 22.06.2019 00:00, gildedav001
When a 757 passenger jet begins its descent to the ronald reagan national airport in washington, d. c., it is 3900 feet from the ground. its angle of descent is 6 degrees. how far must the plane fly to reach the run way? a. 37,106 ft b. 37,310.4 ft c. 23,456.6 ft d 2,492.7 ft
Answers: 2
You know the right answer?
The graphs below show some data from a coffee shop menu. One of the graphs shows cost (in dollar) vs...
Questions in other subjects:

Spanish, 06.02.2021 01:20

English, 06.02.2021 01:20
Spanish, 06.02.2021 01:20

Biology, 06.02.2021 01:20
Mathematics, 06.02.2021 01:20

Chemistry, 06.02.2021 01:20
Spanish, 06.02.2021 01:20
Biology, 06.02.2021 01:20
Mathematics, 06.02.2021 01:20


