
Mathematics, 20.10.2020 04:01 Alangs
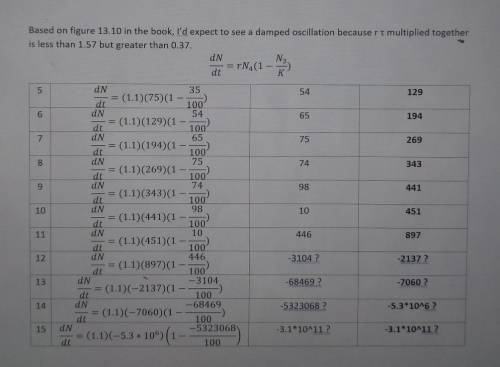
Using data provided, calculate the population size of the plant from year 5 through year 15. based on the product of rt, what type of oscillating behavior do you expect to see in the population even before doing the calculations? graph the results.
data provided:
K=100
t=1
r=1.1
=rN2(1-(N1/K))
There are 10 plants per square meter in year 1 and 20 plants in year 2. based on the data what is the expected change in population in year 3.
(1.1)(20)(1- (10/100) =20
20+20= 40 individuals in year 3
year 4: (1.1)(40)(1- (20/100) =35
35 + 40= 75 individuals
I solved this but I ended up getting negative numbers. I'm not sure what I did wrong or if I even did anything wrong. please help

Answers: 3


Other questions on the subject: Mathematics
Mathematics, 22.06.2019 02:00, lala158736
Which of the following choices gives you a slope of 3?
Answers: 1
Mathematics, 22.06.2019 03:00, danielroytman1
Step by step explanation pls for 10 pts the length of a rectangular board is 3 feet less than twice its width. a second rectangular board is such that each of its dimensions is the reciprocal of the corresponding dimensions of the first rectangular board. if the perimeter of the second board is one-fifth the perimeter of the first, what is the perimeter of the first rectangular board?
Answers: 1
You know the right answer?
Using data provided, calculate the population size of the plant from year 5 through year 15. based o...
Questions in other subjects:


World Languages, 24.01.2020 23:31
Mathematics, 24.01.2020 23:31

Biology, 24.01.2020 23:31


