
Mathematics, 20.10.2020 04:01 dariel41
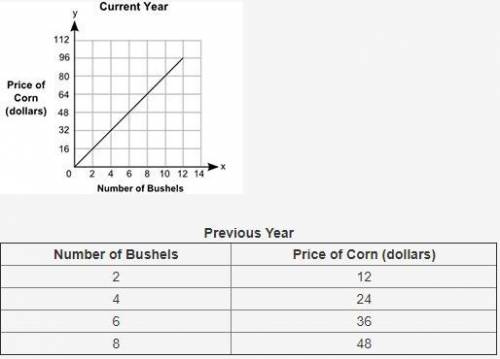
The graph shows the prices of different numbers of bushels of corn at a store in the current year. The table shows the prices of different numbers of bushels of corn at the same store in the previous year.
A graph shows Number of Bushels on x-axis and Price of Corn in dollars on y-axis. The x-axis scale is shown from 0 to 14 at increments of 2, and the y-axis scale is shown from 0 to 112 at increments of 16. A straight line joins the ordered pairs 2, 16 and 4, 32 and 6, 48 and 8, 64 and 10, 80 and 12, 96.
Previous Year
Number of Bushels
Price of Corn (dollars)
2
12
4
24
6
36
8
48
Part A: Describe in words how you can find the rate of change of a bushel of corn in the current year, and find the value. (5 points)
Part B: How many dollars more is the price of a bushel of corn in the current year than the price of a bushel of corn in the previous year? Show your work. (5 points)

Answers: 3


Other questions on the subject: Mathematics
Mathematics, 21.06.2019 17:00, joejoefofana
Need on this one asap im almost done with this subject
Answers: 1
Mathematics, 21.06.2019 17:30, muhammadcorley123456
Miranda is braiding her hair. then she will attach beads to the braid. she wants 1_3 of the beads to be red. if the greatest number of beads that will fit on the braid is 12,what other fractions could represent the part of the beads that are red?
Answers: 3
Mathematics, 21.06.2019 19:50, keigleyhannah30
Use composition to determine if (x) or h(x) is the inverse of f(x) for the limited domain x2-1.
Answers: 3
You know the right answer?
The graph shows the prices of different numbers of bushels of corn at a store in the current year. T...
Questions in other subjects:
Mathematics, 26.08.2019 01:10


Mathematics, 26.08.2019 01:10
Mathematics, 26.08.2019 01:10
History, 26.08.2019 01:10


Physics, 26.08.2019 01:10
English, 26.08.2019 01:10


