
Mathematics, 20.10.2020 01:01 blognero
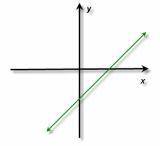
Determine if the graph represents a polynomial function. If it is a polynomial function, then determine the number of turning points and the least degree possible.
a) This graph is not a polynomial. This line is of the form y = mx + b; there are no variables in the expression.
b) This is not a polynomial. Lines are not polynomials. There are no turning points.
c) Yes, this graph represents a polynomial. This line is of the form y = mx + b; there are no turning points as it is a polynomial of degree zero.
d) Yes, this graph represents a polynomial. This line is of the form y = mx + b; there are no turning points as it is a polynomial of degree one.

Answers: 2


Other questions on the subject: Mathematics
Mathematics, 22.06.2019 02:30, sassycutie523
The upcoming championship high school football game is a big deal in your little town. the problem is, it is being played in the next biggest town, which is two hours away! to get as many people as you can to attend the game, you decide to come up with a ride-sharing app, but you want to be sure it will be used before you put all the time in to creating it. you determine that if more than three students share a ride, on average, you will create the app. you conduct simple random sampling of 20 students in a school with a population of 300 students to determine how many students are in each ride-share (carpool) on the way to school every day to get a good idea of who would use the app. the following data are collected: 6 5 5 5 3 2 3 6 2 2 5 4 3 3 4 2 5 3 4 5 construct a 95% confidence interval for the mean number of students who share a ride to school, and interpret the results. part a: state the parameter and check the conditions. part b: construct the confidence interval. be sure to show all your work, including the degrees of freedom, critical value, sample statistics, and an explanation of your process. part c: interpret the meaning of the confidence interval. part d: use your findings to explain whether you should develop the ride-share app for the football game.
Answers: 3
Mathematics, 22.06.2019 06:00, bpo2205748
Suppose jose bars 4 pounds of sausage that cost $8.79 per pound a bottle of mustard that cost $1.38 and two loaves of cuban bread that cost $3.99 each how much did jose spend in all
Answers: 1
Mathematics, 22.06.2019 06:00, dakotagorski05
Ineed with numbers 8,9and10 answer fast i have 10 minutes
Answers: 2
You know the right answer?
Determine if the graph represents a polynomial function. If it is a polynomial function, then determ...
Questions in other subjects:

English, 17.11.2020 20:00

History, 17.11.2020 20:00

Spanish, 17.11.2020 20:00

Physics, 17.11.2020 20:00
English, 17.11.2020 20:00


