
Mathematics, 19.10.2020 19:01 abbbaayyyy1709
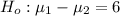
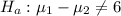
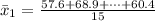
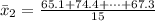
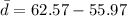
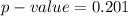
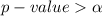
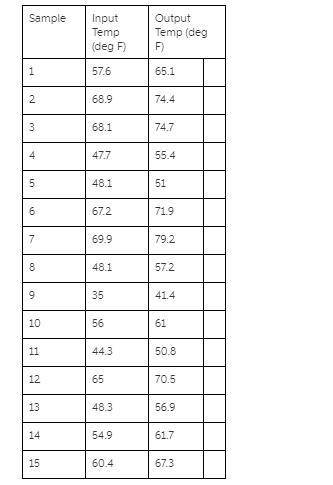
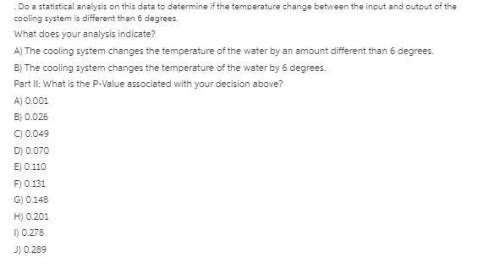
An environmental engineer is tasked with determining whether a power plant cooling system is heating the water it uses more than allowed by environmental regulations. They measure water temperatures at the cooling system input and the cooling system output for several different days in several different seasons. A data file containing these measurements is HW_PTA 243.csv. Do a statistical analysis on this data to determine if the temperature change between the input and output of the cooling system is different than 6 degrees. What does your analysis indicate?
A) The cooling system changes the temperature of the water by an amount different than 6 degrees.
B) The cooling system changes the temperature of the water by 6 degrees.

Answers: 1


![s_d = \sqrt{\frac{ \sum [d_1 - \= d]^2}{n-1} }](/tpl/images/0821/1143/28bd8.png)
![s_d = \sqrt{\frac{ [ [57.6 -65.1]- 6.6]^2 +[68.9 -74.4]- 6.6]^2+\cdots + [60.4 -67.3]- 6.6]^2}{15-1} }](/tpl/images/0821/1143/58f71.png)


 is
is 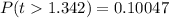

 Hence
Hence 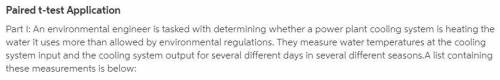


Other questions on the subject: Mathematics
Mathematics, 21.06.2019 23:00, nataliemakin7123
Which rectangle if translated 6 units right and 16 units down and the rotated 90° clockwise about the point (4, -11) will result in rectangle e?
Answers: 2
Mathematics, 22.06.2019 00:50, NayeliNoel
E. which of the following is not a possible probability? a. 25/100 b. 1.25 c. 1 d. 0
Answers: 1
Mathematics, 22.06.2019 01:20, anarosa331hotmailcom
Which equation is represented by the graph below?
Answers: 2
You know the right answer?
An environmental engineer is tasked with determining whether a power plant cooling system is heating...
Questions in other subjects:


Social Studies, 06.10.2019 09:02

Chemistry, 06.10.2019 09:02


