
Mathematics, 18.10.2020 08:01 lukerothbacher
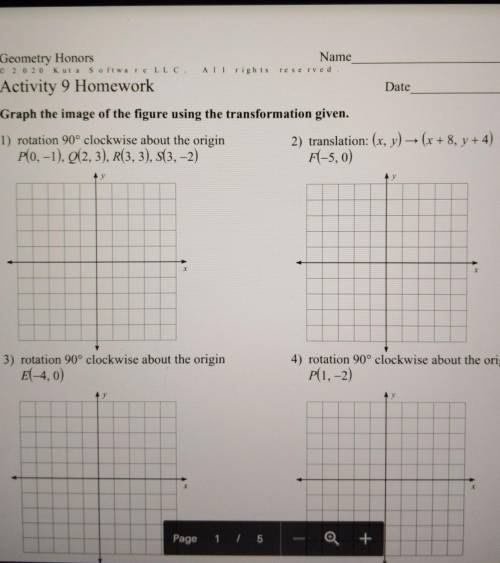
This is due soon today can somebody help? 35 points (if they're all right) comment if you don't know it

Answers: 2


Other questions on the subject: Mathematics
Mathematics, 21.06.2019 16:00, kell22wolf
Part one: measurements 1. measure your own height and arm span (from finger-tip to finger-tip) in inches. you will likely need some from a parent, guardian, or sibling to get accurate measurements. record your measurements on the "data record" document. use the "data record" to you complete part two of this project. name relationship to student x height in inches y arm span in inches archie dad 72 72 ginelle mom 65 66 sarah sister 64 65 meleah sister 66 3/4 67 rachel sister 53 1/2 53 emily auntie 66 1/2 66 hannah myself 66 1/2 69 part two: representation of data with plots 1. using graphing software of your choice, create a scatter plot of your data. predict the line of best fit, and sketch it on your graph. part three: the line of best fit include your scatter plot and the answers to the following questions in your word processing document 1. 1. which variable did you plot on the x-axis, and which variable did you plot on the y-axis? explain why you assigned the variables in that way. 2. write the equation of the line of best fit using the slope-intercept formula $y = mx + b$. show all your work, including the points used to determine the slope and how the equation was determined. 3. what does the slope of the line represent within the context of your graph? what does the y-intercept represent? 5. use the line of best fit to you to describe the data correlation.
Answers: 2
Mathematics, 22.06.2019 01:30, mariaguadalupeduranc
In 2000, for a certain region, 27.1% of incoming college freshman characterized their political views as liberal, 23.1% as moderate, and 49.8% as conservative. for this year, a random sample of 400 incoming college freshman yielded the frequency distribution for political views shown below. a. determine the mode of the data. b. decide whether it would be appropriate to use either the mean or the median as a measure of center. explain your answer. political view frequency liberal 118 moderate 98 conservative 184 a. choose the correct answer below. select all that apply. a. the mode is moderate. b. the mode is liberal. c. the mode is conservative. d. there is no mode.
Answers: 1
Mathematics, 22.06.2019 02:20, officialrogerfp3gf2s
Two researchers are attempting to create a new psychotherapy protocol that more reduces panic attacks. they believe that they have succeeded and are now in the clinical trial period of their protocol's development. they are working with several cohort groups, some of which have been through the new protocol, while others have done the standard protocol currently recommended. if these researchers are interested in evaluating the difference in the percentage of test subjects who successfully decreased their panic attacks in 2 months on the new protocol versus the percentage of test subjects who successfully decreased their panic attacks in 2 months with the traditional protocol, which of the following statistical tests would be most appropriate? a. analysis of variance (anova) b. correlation c. chi-square test d. paired t-test e. independent t-test
Answers: 2
Mathematics, 22.06.2019 03:30, moneymaleia92
Right triangle abc has three sides with lengths ab= 119, bc = 169, ca= 120. find the value of cos c. hint: draw and label the triangle. the hypotenuse is always the longest.
Answers: 2
You know the right answer?
This is due soon today can somebody help?
35 points (if they're all right) comment if you don't k...
Questions in other subjects:

Mathematics, 30.01.2020 10:56

Mathematics, 30.01.2020 10:56


