
The table represents some points on
the graph of a linear function.
Х
y
-11
...

Mathematics, 18.10.2020 07:01 ishrael2001
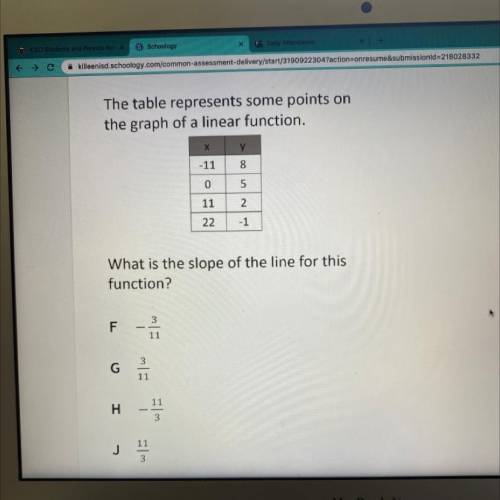
The table represents some points on
the graph of a linear function.
Х
y
-11
8
0
5
11
2
22
-1
What is the slope of the line for this
function?
3
F -
11
3
G
11
11
H
3
11
J
3

Answers: 3


Other questions on the subject: Mathematics
Mathematics, 21.06.2019 16:00, goodygoodgirlygirl
If the measure of angle 1 is 110 degrees and the measure of angle 3 is (2 x+10 degree), what is the value of x?
Answers: 2
Mathematics, 21.06.2019 16:00, ringo12384
You eat 8 strawberries and your friend eats 12 strawberries from a bowl. there are 20 strawberries left. which equation and solution give the original number of strawberries?
Answers: 1
Mathematics, 21.06.2019 20:10, Maddi7328
The graph and table shows the relationship between y, the number of words jean has typed for her essay and x, the number of minutes she has been typing on the computer. according to the line of best fit, about how many words will jean have typed when she completes 60 minutes of typing? 2,500 2,750 3,000 3,250
Answers: 1
You know the right answer?
Questions in other subjects:
Mathematics, 04.02.2021 22:50
Mathematics, 04.02.2021 22:50
Mathematics, 04.02.2021 22:50

English, 04.02.2021 22:50
English, 04.02.2021 22:50

History, 04.02.2021 22:50

History, 04.02.2021 22:50


