
Mathematics, 17.10.2020 21:01 marziel24
Question 9 (1 point)
The histograms and summary statistics summarize the data for the number of hits in the season by baseball players
in two leagues. Each data set contains one outlier. What are the values of the two outliers? Explain how each value
is determined to be an outlier.
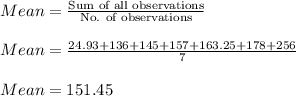
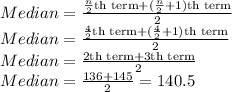
Some summary statistics for the number of hits by players in each league.
mean median standard deviation minimum Q1 Q3
maximum
league A 151.12 148 26.83
29
136 167 207
league B 163.25 157 24.93
136 145 178 256
Plsss helppp

Answers: 3

 =
=


Other questions on the subject: Mathematics
Mathematics, 21.06.2019 19:30, tsmalls70988
What is the image of c for a 90° counterclockwise rotation about a? (3, 7) (-1, 3) (7, 3)
Answers: 1
Mathematics, 21.06.2019 20:00, bermudezs732
Graph the linear function using the slooe and y intercept
Answers: 2
Mathematics, 21.06.2019 21:00, memoryofdale
Circle a has a diameter of 7 inches, a circumference of 21.98 inches, and an area of 38.465 square inches. the diameter of circle b is 6 inches, the circumference is 18.84 inches, and the area is 28.26 square inches. part a: using the formula for circumference, solve for the value of pi for each circle. (4 points) part b: use the formula for area and solve for the value of pi for each circle. (4 points)
Answers: 2
You know the right answer?
Question 9 (1 point)
The histograms and summary statistics summarize the data for the number of hit...
Questions in other subjects:

Chemistry, 07.12.2020 23:20
Mathematics, 07.12.2020 23:20


Mathematics, 07.12.2020 23:20
Mathematics, 07.12.2020 23:20


