
Mathematics, 17.10.2020 14:01 DarkWolf983
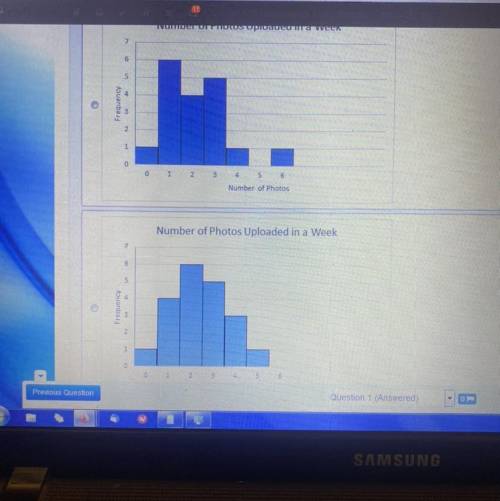
The following table respresents the results of a survey of 20 students asked how many pictures they take with their smartphone each day to post to social media. Which histogram best represents this survey data?

Answers: 3


Other questions on the subject: Mathematics
Mathematics, 21.06.2019 15:00, katiebotts18
The diameter of a ball is 8 in. what is the volume of the ball? use 3.14 for pi. enter your answer as a decimal in the box. round only your final answer to the nearest hundredth.
Answers: 2
Mathematics, 21.06.2019 15:30, erykaa
Suppose you want just guess at the answers in a 5 question multiple-choice test. each question has 3 responses and only one is correct. what is the probability of getting two questions right just guessing? 20 points 0.3275 0.2753 0.7532 none of the above
Answers: 3
Mathematics, 21.06.2019 19:30, sotoamerica0814
What is the effect on the graph of the function f(x)=x when f(x) is replaced with -f(x)+4
Answers: 1
Mathematics, 21.06.2019 22:00, laureimaneaxel
The table below lists recommended amounts of food to order for 10 party guests. how much of each food item should nathan and amanda order for a graduation party with 55 guests? use the table to answer. item amount fried chicken 16 pieces lasagna 7 pounds deli meats 1.8 pounds sliced cheese 1 and two fifths pounds bakery buns 1 dozen potato salad 2 pounds
Answers: 3
You know the right answer?
The following table respresents the results of a survey of 20 students asked how many pictures they...
Questions in other subjects:

Mathematics, 26.08.2021 19:00


Biology, 26.08.2021 19:00
Mathematics, 26.08.2021 19:00

Mathematics, 26.08.2021 19:00


