
Mathematics, 16.10.2020 23:01 znewkirk4741
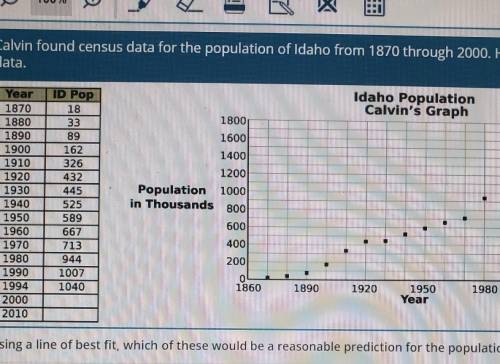
Calvin found census data for the population of Idaho from 1870 through 2000. He made the chart and scatter plot using this data.

Answers: 2


Other questions on the subject: Mathematics
Mathematics, 21.06.2019 23:30, jadenweisman1
The approximate line of best fit for the given data points, y = −2x − 2, is shown on the graph. which is the residual value when x = –2? a)–2 b)–1 c)1 d)2
Answers: 2
You know the right answer?
Calvin found census data for the population of Idaho from 1870 through 2000. He made the chart and s...
Questions in other subjects:

Mathematics, 23.06.2019 12:30


