
Mathematics, 16.10.2020 23:01 nayelidlc2
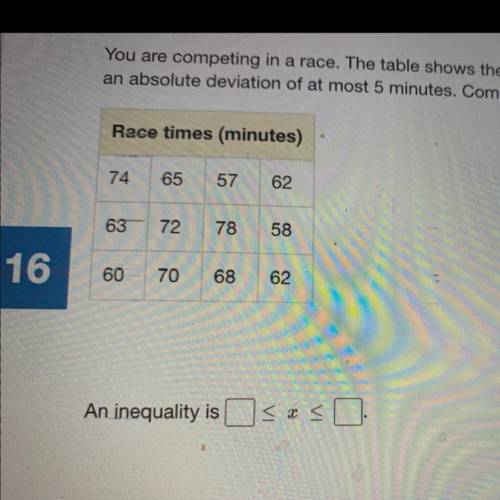
You are competing in a race. The table shows the times from last year's race. You want your time to be last year's median time with
an absolute deviation of at most 5 minutes. Complete the inequality to represent the time (in minutes) you hope to achieve.
HELP PLEASE !!!

Answers: 1


Other questions on the subject: Mathematics
Mathematics, 21.06.2019 13:00, aaron2113
Use this data in the problem below. follow the steps carefully. round to the nearest tenth. lot 3: week 1: 345 week 2: 340 week 3: 400 week 4: 325 step 1. jim enters the data and calculates the average or mean. step 2. jim calculates the deviation from the mean by subtracting the mean from each value. step 3. jim squares each deviation to remove negative signs. step 4. jim sums the squares of each deviation and divides by the count for the variance. step 5. jim takes the square root of the variance to find the standard deviation.
Answers: 2
Mathematics, 21.06.2019 18:10, russbeast6584
What is the value of x in the following equation. -x ^3/2 = -27
Answers: 1
Mathematics, 21.06.2019 23:00, janeou17xn
The equation shown below represents function f. f(x)= -2x+5 the graph shown below represents function g. which of the following statements is true? a. over the interval [2, 4], the average rate of change of f is the same as the average rate of change of g. the y-intercept of function f is less than the y-intercept of function g. b. over the interval [2, 4], the average rate of change of f is greater than the average rate of change of g. the y-intercept of function f is greater than the y-intercept of function g. c. over the interval [2, 4], the average rate of change of f is the same as the average rate of change of g. the y-intercept of function f is greater than the y-intercept of function g. d. over the interval [2, 4], the average rate of change of f is less than the average rate of change of g. the y-intercept of function f is the same as the y-intercept of function g.
Answers: 1
Mathematics, 22.06.2019 02:00, 791197
Will make ! for correct answer the dot plot below shows the number of toys 21 shops sold in an hour. is the median or the mean a better center for this data and why? a. median; because the data is not symmetric and there are outliersb. median; because the data is symmetric and there are no outliersc. mean; because the data is symmetric and there are no outliersd. mean; because the data is skewed and there are outliers
Answers: 2
You know the right answer?
You are competing in a race. The table shows the times from last year's race. You want your time to...
Questions in other subjects:

Mathematics, 04.07.2019 08:30
Mathematics, 04.07.2019 08:30


English, 04.07.2019 08:30


