Mathematics, 16.10.2020 17:01 dee2970
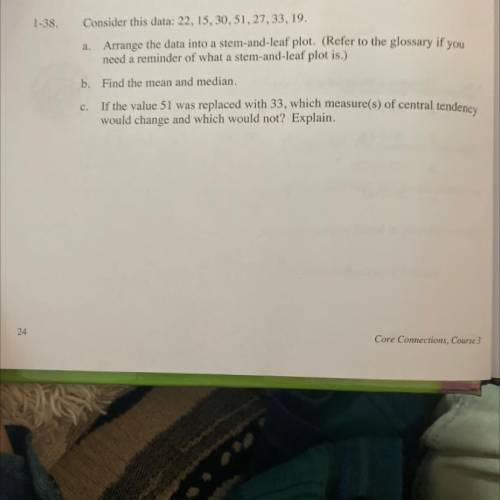
A)Consider this data: 22. 15, 30, 51, 27, 33, 19.
Arrange the data into a stem-and-leaf plot. (Refer to the glossary if you
need a reminder of what a stem-and-leaf plot is.)
b. Find the mean and median.
c. If the value 51 was replaced with 33, which measure(s) of central tendency
would change and which would not? Explain


Answers: 2


Other questions on the subject: Mathematics

Mathematics, 20.06.2019 18:04, sindy35111
You can model the population of a certain city between 1955-2000 by the radical function p(x)=55,000 sqrt x-1945. using this model, in which year was the population of that city 220,000
Answers: 1

Mathematics, 21.06.2019 14:00, shyannehamilton1183
What values of c and d make the equation true?
Answers: 1

Mathematics, 21.06.2019 19:00, ivethzurita0425
{0,1,2,3,4,5,6,20,21,22,23,24,25} the distribution is considered to be: skewed the right, skewed the left, not skewed?
Answers: 1
You know the right answer?
A)Consider this data: 22. 15, 30, 51, 27, 33, 19.
Arrange the data into a stem-and-leaf plot. (Refe...
Questions in other subjects:


Mathematics, 18.03.2021 01:50


Social Studies, 18.03.2021 01:50


