
Mathematics, 16.10.2020 19:01 maudiejane
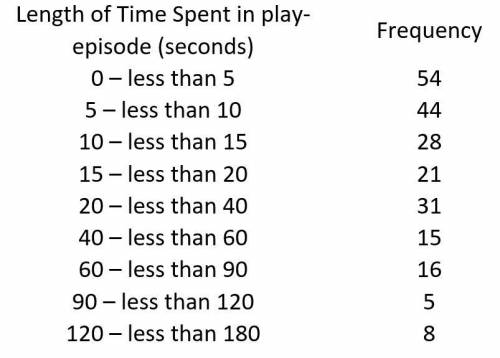
Over a period of many months, a particular 5 year old boy's play activity was observed. The length of time spent in each episode of play with toys was recorded. The paper “A Temporal Analysis of Free Toy Play and Distractibility in Young Children" (Journal of Experimental Child Psychology, 1991,pages 41-69) reported the accompanying data on the play-episode lengths.
(a).Use the data to calculate the density for the 20 to < 40 minute period
(b). Over a period of many months, a particular 5 year old boy's play activity was observed. The length of time spent in each episode of play with toys was recorded. The paper “A Temporal Analysis of Free Toy Play and Distractibility in Young Children" (Journal of Experimental Child Psychology, 1991,pages 41-69) reported the accompanying data on the play-episode lengths.
(a). Use the data to calculate the density for the 20 to < 40 minute period
(b). What is the probability that the play time was less than 75 seconds ?
(c). Use the data to calculate the relative frequency for the 5 to < 10 range.

Answers: 2


Other questions on the subject: Mathematics
Mathematics, 21.06.2019 12:50, Kaylinne1181
The table shows a pattern of exponents. what is the pattern as the exponents decrease?
Answers: 3
Mathematics, 21.06.2019 20:00, CelesteN64
For problems 29 - 31 the graph of a quadratic function y=ax^2 + bx + c is shown. tell whether the discriminant of ax^2 + bx + c = 0 is positive, negative, or zero.
Answers: 1
You know the right answer?
Over a period of many months, a particular 5 year old boy's play activity was observed. The length o...
Questions in other subjects:
Mathematics, 15.04.2020 06:15

Biology, 15.04.2020 06:15

Mathematics, 15.04.2020 06:15
Mathematics, 15.04.2020 06:15


