
Mathematics, 16.10.2020 08:01 eraines1714
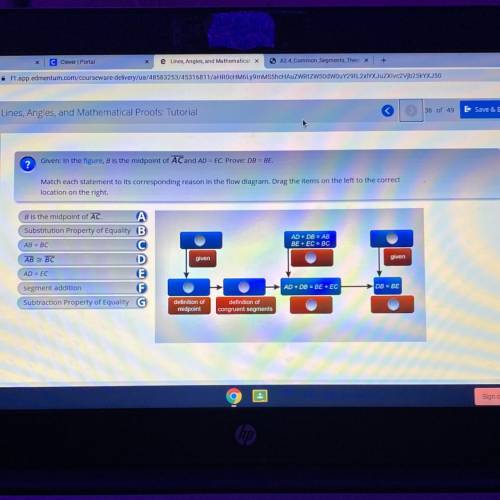
Given: In the figure, B is the midpoint of AC and AD = EC. Prove: DB = BE.
Match each statement to its corresponding reason in the flow diagram. Drag the items on the left to the correct
location on the right.

Answers: 2


Other questions on the subject: Mathematics
Mathematics, 21.06.2019 13:40, kkeith121p6ujlt
Questions 14 through 23, choose the onest answer. write your answer in the box forestion 24. mark your answer on the coordinatene grid for question 25.the sum of three consecutive even numbers is 96.what is the largest of these numbers? (a) 30(b) 32(c) 34(d) 36
Answers: 2
Mathematics, 21.06.2019 17:30, redbenji1687
Describe the 2 algebraic methods you can use to find the zeros of the function f(t)=-16t^2+400.
Answers: 3
Mathematics, 22.06.2019 01:00, s27511583
The weight of 46 new patients of a clinic from the year 2018 are recorded and listed below. construct a frequency distribution, using 7 classes. then, draw a histogram, a frequency polygon, and an ogive for the data, using the relative information from the frequency table for each of the graphs. describe the shape of the histogram. data set: 130 192 145 97 100 122 210 132 107 95 210 128 193 208 118 196 130 178 187 240 90 126 98 194 115 212 110 225 187 133 220 218 110 104 201 120 183 124 261 270 108 160 203 210 191 180 1) complete the frequency distribution table below (add as many rows as needed): - class limits - class boundaries - midpoint - frequency - cumulative frequency 2) histogram 3) frequency polygon 4) ogive
Answers: 1
You know the right answer?
Given: In the figure, B is the midpoint of AC and AD = EC. Prove: DB = BE.
Match each statement to...
Questions in other subjects:


History, 30.08.2019 10:30

History, 30.08.2019 10:30


