
Mathematics, 16.10.2020 05:01 timothycarter342
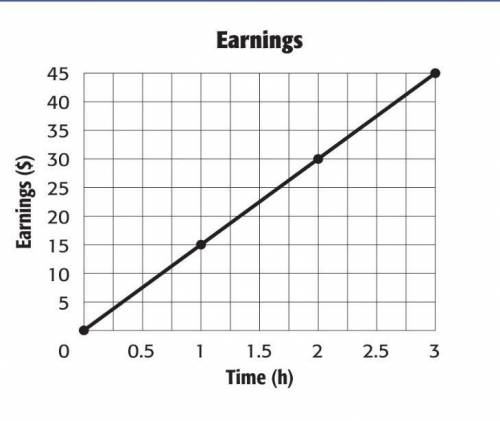
The graph shows the amount of money Joe earns each hour he works. Which statement about the graph is not true?
OPTIONS:
F. The graph shows a proportional relationship.
G. The graph shows a nonproportional relationship.
H. The unit rate is $15 hour.
I. The line is straight.

Answers: 3


Other questions on the subject: Mathematics
Mathematics, 21.06.2019 13:30, angelina0miles
For which rational expression is -2 an excluded value of x?
Answers: 1
Mathematics, 21.06.2019 14:30, nunnielangley0
The contents of 3838 cans of coke have a mean of x¯¯¯=12.15x¯=12.15. assume the contents of cans of coke have a normal distribution with standard deviation of σ=0.12.σ=0.12. find the value of the test statistic zz for the claim that the population mean is μ=12.μ=12.
Answers: 1
Mathematics, 21.06.2019 19:30, student0724
Ariel is working at a meat packing plant for 5 nights a week. her regular wage is $11 an hour. she earns tine and a half for any overtime hours. this week she worked 9 hours of over time .how much will ariel earn for overtime this week ?
Answers: 1
You know the right answer?
The graph shows the amount of money Joe earns each hour he works. Which statement about the graph is...
Questions in other subjects:

Mathematics, 28.01.2021 16:10
Mathematics, 28.01.2021 16:10
English, 28.01.2021 16:10


