
Mathematics, 15.10.2020 20:01 johanperezpere51
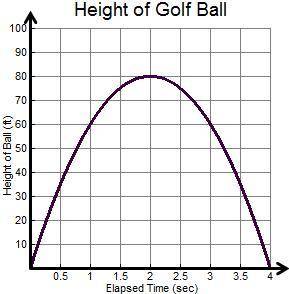
The graph below represents the height of a golf ball in feet as a function of the elapsed time since it was hit. The golf ball was in the air for 4 seconds.
What are the domain and range of the representative function?
A)Domain: 0 ≤ x ≤ 4
Range: 0 ≤ y ≤ 80
B)Domain: 0 < x < 80
Range: 0 < y < 4
C)Domain: 0 < x < 4
Range: 0 < y < 80
D)Domain: 0 ≤ x ≤ 80
Range: 0 ≤ y ≤ 4

Answers: 3


Other questions on the subject: Mathematics
Mathematics, 21.06.2019 13:30, mistiehaas
Cynthia takes her dog to the park every 2 days. she bathes her dog every 7 days. if she took her dog to the park and bathed him today, how long will it be until she does both on the same day again?
Answers: 2
Mathematics, 21.06.2019 21:00, jumeljean123oythxy
Kira looked through online census information to determine the overage number of people living in the homes in her city what is true about kira's data collection?
Answers: 1
Mathematics, 21.06.2019 23:00, kcarstensen59070
Erik buys 2.5 pounds of cashews. if each pound of cashews costs $7.70, how much will he pay for the cashews?
Answers: 1
You know the right answer?
The graph below represents the height of a golf ball in feet as a function of the elapsed time since...
Questions in other subjects:
Mathematics, 05.03.2021 17:40
Mathematics, 05.03.2021 17:40

Chemistry, 05.03.2021 17:40


