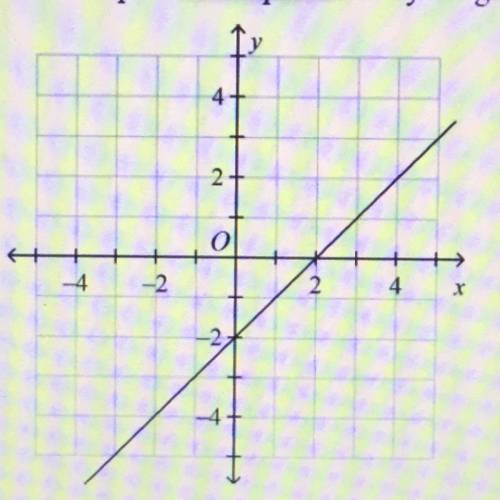
Which equation is represented by the graph?
A. y=x-2
B. y=x+2
C. y=1/x-2
D. y=1/x...

Mathematics, 14.10.2020 14:01 robert7248
Which equation is represented by the graph?
A. y=x-2
B. y=x+2
C. y=1/x-2
D. y=1/x+2

Answers: 1


Other questions on the subject: Mathematics
Mathematics, 21.06.2019 18:30, travorissteele822
The table shows the relationship between the number of cups of cereal and the number of cups of raisins in a cereal bar recipe: number of cups of cereal number of cups of raisins 8 2 12 3 16 4 molly plotted an equivalent ratio as shown on the grid below: a graph is shown. the title of the graph is cereal bars. the horizontal axis label is cereal in cups. the x-axis values are 0, 20, 40, 60, 80,100. the vertical axis label is raisins in cups. the y-axis values are 0, 10, 20, 30, 40, 50. a point is plotted on the ordered pair 40,20. which of these explains why the point molly plotted is incorrect? (a) if the number of cups of cereal is 40, then the number of cups of raisins will be10. (b)if the number of cups of raisins is 40, then the number of cups of cereal will be10. (c) if the number of cups of cereal is 40, then the number of cups of raisins will be 80. (d) if the number of cups of raisins is 40, then the number of cups of cereal will be 80.
Answers: 1
Mathematics, 21.06.2019 19:00, phelanpearson3995
The fraction 7/9 is equivalent to a percent that is greater than 100%. truefalse
Answers: 1
Mathematics, 21.06.2019 19:30, santileiva123199
Factor the following expression. 27y3 – 343 a. (3y + 7)(9y2 + 2ly + 49) b. (3y – 7)(9y2 + 2ly + 49) c. (3y – 7)(932 – 217 + 49) d. (3y + 7)(92 – 2ly + 49)
Answers: 1
Mathematics, 22.06.2019 01:10, journeyburks07
What is the angle measure, or angle of depression, between this bird and the bird watcher?
Answers: 1
You know the right answer?
Questions in other subjects:


