
Mathematics, 13.10.2020 14:01 windline829
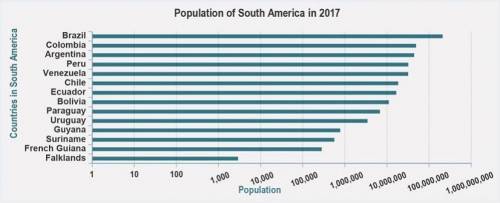
Examine the graph of populations in South American countries.
A bar graph of population in South America in 2017. The x-axis is labeled population from 1 to 1,000,000,000. The y-axis is labeled countries in South America. Brazil is over 100,000,000. Colombia is over 10,000,000. Argentina is over 10,000,000 but less than Colombia. Peru, Venezuela, Chile, Bolivia and Ecuador are over 10,000,000. Paraguay and Uruguay are over 1,000,000. Guyana, Suriname, and French Guiana are over 100,000. Falklands is over 1,000.
Which is the best conclusion that can be drawn from the data in the graph?
The most-populous cities in South America are in Brazil.
Colombia is South America’s second most-populous country.
Brazil has the fastest-growing population of any South American country.
The Falklands have always been South America’s least-populous country.

Answers: 2


Other questions on the subject: Mathematics
Mathematics, 21.06.2019 17:30, neverfnmind
James adds two numbers a + b. sally adds the same two numbers but reverse the order b + a what property of addition assures us that james and sally will get the same sum
Answers: 2
Mathematics, 21.06.2019 21:00, desirekotta20
An account with a $250 balance accrues 2% annually. if no deposits or withdrawals are made, which graph can be used to determine approximately how many years will it take for the balance to be $282? it's e2020 ni️️as
Answers: 1
You know the right answer?
Examine the graph of populations in South American countries.
A bar graph of population in South Am...
Questions in other subjects:
Mathematics, 09.11.2020 19:10

Mathematics, 09.11.2020 19:10

History, 09.11.2020 19:10
Mathematics, 09.11.2020 19:10
History, 09.11.2020 19:10


