
Mathematics, 13.10.2020 09:01 winterblackburn78
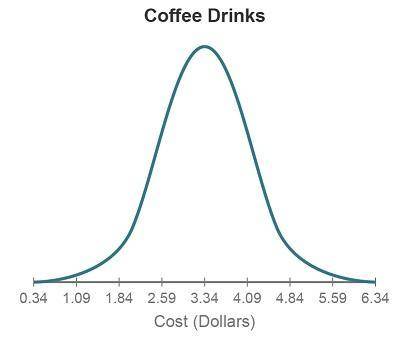
The graph shows the distribution of the cost of drinks at a popular coffee shop. The distribution is approximately Normal, with a mean of $3.34 and a standard deviation of $0.75.
What percentage of coffee drinks cost within $1.50 of the mean?
34%
68%
95%
99.7%

Answers: 1


Other questions on the subject: Mathematics
Mathematics, 21.06.2019 15:00, kayleenfifep3hgi4
Pete is making decorations for a dinner party. the instructions tell him to use 9 flowers for a medium-sized decoration. complete each statement to adjust the flowers for different-sized decorations based on these instructions.
Answers: 2
Mathematics, 21.06.2019 18:00, gyexisromero10
The estimated number of people to attend the last bengals game of the season was 2000. the actual number of fans attending was 1200. by what percent did the estimate differ from the actual?
Answers: 3
Mathematics, 21.06.2019 21:00, nell1234565
A25- foot ladder leans against a building and reaches a point of 23.5 feet above the ground .find the angle that the ladder makes with the building
Answers: 2
You know the right answer?
The graph shows the distribution of the cost of drinks at a popular coffee shop. The distribution is...
Questions in other subjects:
Mathematics, 28.11.2019 00:31
Mathematics, 28.11.2019 00:31
Mathematics, 28.11.2019 00:31

Health, 28.11.2019 00:31
Mathematics, 28.11.2019 00:31

English, 28.11.2019 00:31
Mathematics, 28.11.2019 00:31
English, 28.11.2019 00:31


